Test port input – Atec Agilent-E8364C User Manual
Page 17
17
E8362/3/4C
Test port input
continued
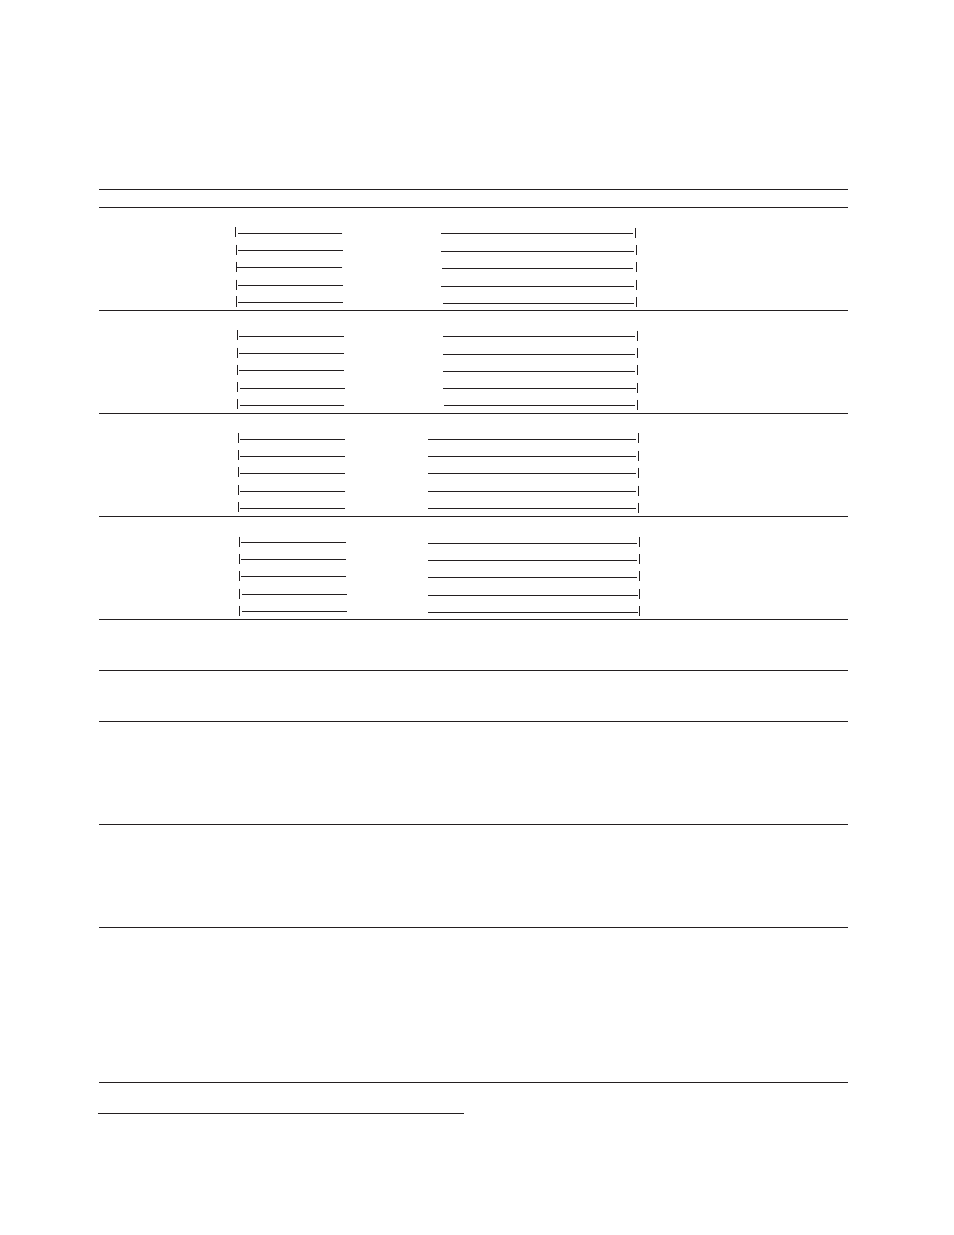
Description Specification
Supplemental
information
Standard
014
UNL
UNL
and
014
Trace noise magnitude
10 to 45 MHz
1
< 0.050 dB rms
45 to 500 MHz
2
< 0.010 dB rms
1 kHz IF bandwidth
500 MHz to 20 GHz
< 0.006 dB rms
Ratio measurement, nominal
20 to 40 GHz
< 0.006 dB rms
power at test port
40 to 50 GHz
< 0.006 dB rms
Trace noise magnitude – Option 080 enabled
1,
4
10 to 45 MHz
1
< 0.060 dB rms
45 to 500 MHz
2
< 0.010 dB rms
1 kHz IF bandwidth
500 MHz to 20 GHz
< 0.006 dB rms
Ratio measurement, nominal
20 to 40 GHz
< 0.007 dB rms
power at test port
40 to 50 GHz
< 0.008 dB rms
Trace noise phase
10 to 45 MHz
1
< 0.350° rms
45 to 500 MHz
2
< 0.100° rms
1 kHz IF bandwidth
500 MHz to 20 GHz
< 0.060° rms
Ratio measurement, nominal
20 to 40 GHz
< 0.100° rms
power at test port
40 to 50 GHz
< 0.100° rms
Trace noise phase – Option 080 enabled
1,
4
10 to 45 MHz
1
< 0.350° rms
45 to 500 MHz
2
< 0.100° rms
1 kHz IF bandwidth
500 MHz to 20 GHz
< 0.060° rms
Ratio measurement, nominal
20 to 40 GHz
< 0.100° rms
power at test port
40 to 50 GHz
< 0.100° rms
Reference level magnitude
Range
±200 dB
±200 dB
±200 dB
±200 dB
Resolution
0.001 dB
0.001 dB
0.001 dB
0.001 dB
Reference level phase
Range
±500°
±500°
±500°
±500°
Resolution
0.01°
0.01°
0.01°
0.01°
Stability magnitude
3
Typical ratio measurement:
Measured
at
the
test
port
10 to 45 MHz
±0.05 dB/°C
45 MHz to 20 GHz
±0.02 dB/°C
20 to 40 GHz
±0.03 dB/°C
40 to 50 GHz
±0.04 dB/°C
Stability phase
3
Typical ratio measurement:
Measured
at
the
test
port
10 to 45 MHz
±0.5°/°C
45 MHz to 20 GHz
±0.2°/°C
20 to 40 GHz
±0.5°/°C
40 to 50 GHz
±0.8°/°C
Damage input level
Test port 1 and 2
30 dBm or ±40 VDC, typical
R1, R2 in
15 dBm or ±15 VDC, typical
A, B in
15 dBm or ±15 VDC, typical
Coupler thru (Option 014 or UNL and 014)
30 dBm or ±40 VDC, typical
Coupler arm (Option 014 or UNL and 014)
30 dBm or ±7 VDC, typical
Source out (reference)
20 dBm or ±15 VDC, typical
Source out (test ports)
20 dBm or 0 VDC, typical
1. Typical performance.
2. Trace noise magnitude may be degraded to 20 mdB rms at harmonic frequencies
of the first IF (8.33 MHz) below 80 MHz.
3. Stability is defined as a ratio measurement measured at the test port.
4. 0 Hz offset.