4 displaying recorded measured values, Displaying recorded measured values -17, Section 4.4.4) – YSI IQ SensorNet 2020 XT Terminal User Manual
Page 95
System 2020 XT USB
Operation
4 - 17
ba76019e01
12/2012
4.4.4
Displaying recorded measured values
If the measured value recording has been activated for an IQ sensor
(see section 5.12), the temporal course of the recorded measured
values can be displayed numerically and graphically.
The following display options are possible:
Monthly load of selected sensor (graphic display)
Weekly load of selected sensor (graphic display)
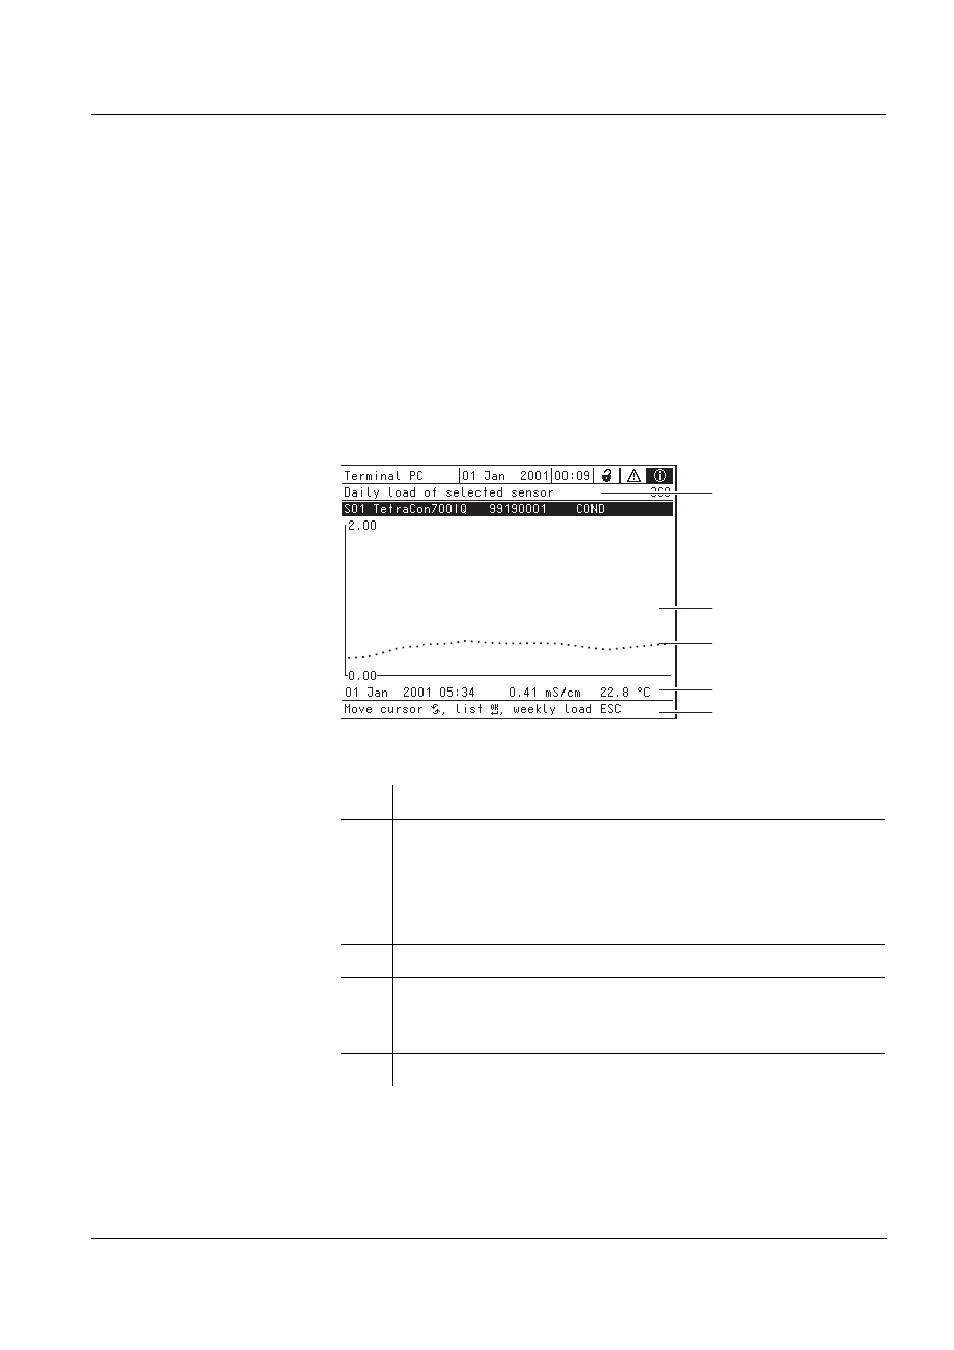
Daily load of selected sensor (graphic display)
Measured value list of selected sensor (numerical display)
Fig. 4-12 Daily load of selected sensor (example)
1
Display
2
Range of the graphical display
The time range (x axis) corresponds to the selected display
option (1 day, 1 week, 1 month).
The value range of the y-axis is automatically adjusted to
min and max values
3
Position of the cursor (X)
4
Data about the position of the cursor (X)
(Date, time, main measured value and adjoining measured
value)
5
Navigation instructions
1
4
5
2
3
X