Summary reports – Fortinet FortiAnalyzer 3.0 MR7 User Manual
Page 213
Appendix: FortiAnalyzer reports in 3.0 MR7
Summary Reports
FortiAnalyzer Version 3.0 MR7 Administration Guide
005-30007-0082-20080908
201
Summary Reports
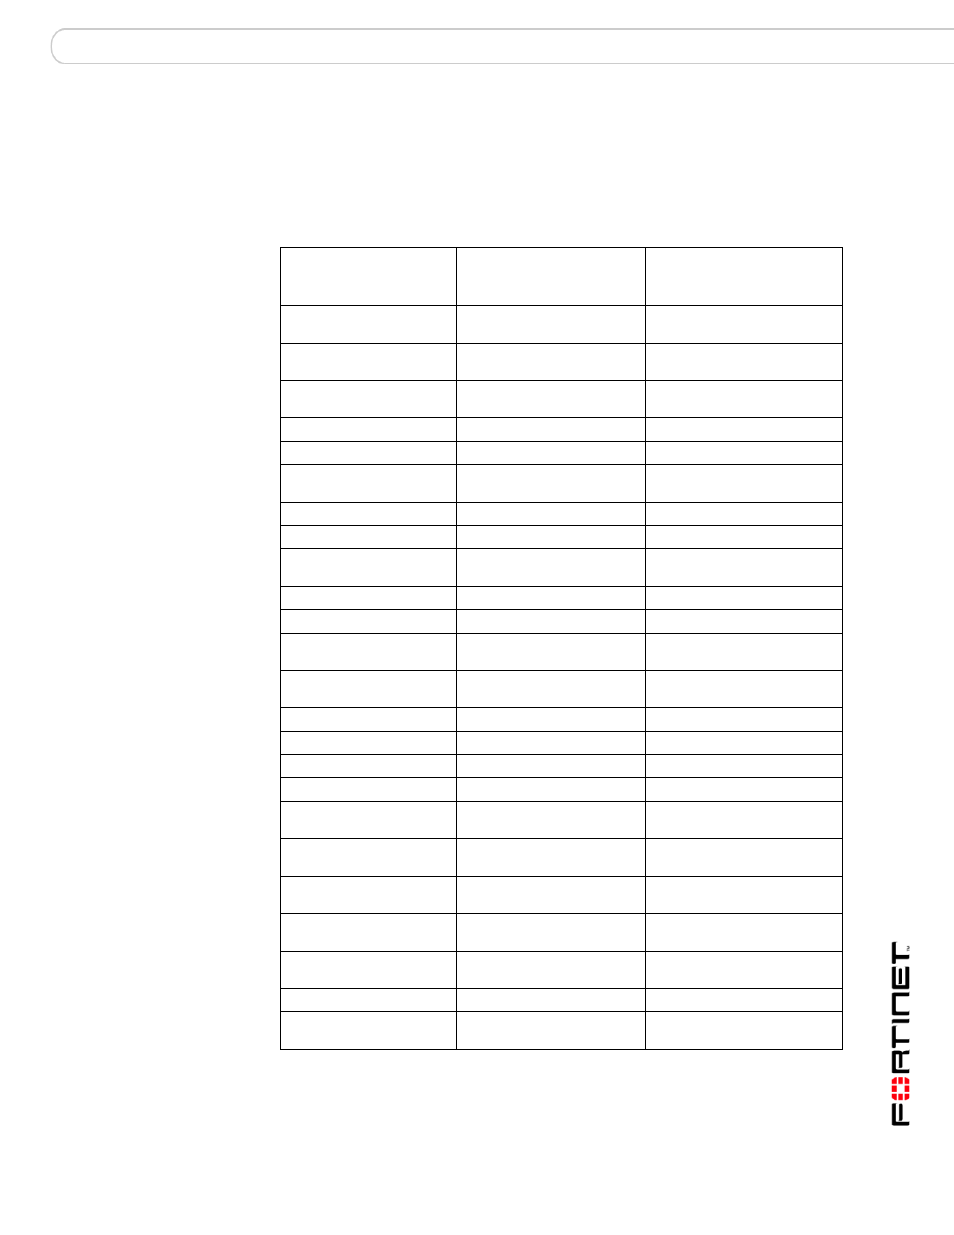
The following table explains what Summary reports have changed and what they
were changed to in FortiAnalyzer 3.0 MR7, including the category, if applicable, of
where the re-named FortiAnalyzer 3.0 MR6 reports were moved to.
The following reports remain unchanged but are moved to a new category in
FortiAnalyzer 3.0 MR7:
Table 25: Summary reports
MR6 reports
MR7 reports
Category that reports were
moved to in MR7 (if
applicable)
Top Bandwidth Consumers
by Source
Top Sources by Volume
Network Analysis
Top Bandwidth
Comsumption
Traffic Volume per Device
Network Analysis
Top Bandwidth Consumers
by Destination
Top Viruses
AntiVirus Activity
Total Viruses Detected
Top Virus Sources
AntiVirus Activity
Top Viruses by Name
Top Virus Destinations
AntiVirus Activity
Top Viruses by Source
Top Devices by Number of
Attack Detection
Intrusion Activity
Top Viruses by Destination Top Attacks
Intrusion Activity
Total IPS Events Detected Top Destinations by Volume Network Analysis
Total IPS by Attack ID
Top Devices by Antivirus
Violations
AntiVirus Activity
Total IPS by Source
Top Attack Sources
Intrusion Activity
Total IPS by Destination
Top Attack Destinations
Intrusion Activity
Total Spam Activity
Total Spam per Device
(by Email Count)
AntiSpam Activity
Bandwidth Consumed by
Spam
Total Spam per Device
(by Email Size)
AntiSpam Activity
Total Web Filter Activity
Total Hits per Device
WebFilter Activity
Top Web Categories
Top Requested Categories
WebFilter Activity
Top Clients Filtered
Top Blocked Web User
WebFilter Activity
Top Servers Filtered
Top Blocked Web Sites
WebFilter Activity
Total Content Archived
Volume of Filtered Content
per Device
Content Activity
Top Archived Content
Type
Volume of Filtered Content
per Application
Content Activity
Top Archived Sources
Volume of Filtered Content
per Source
Content Activity
Total Events Triggered
Total Event Count per
Device
Event Activity
Total Events Triggered by
Category
Total Event Count per
Severity
Event Activity
Protocol Distribution
Top Services by Volume
Network Analysis
Total Events Triggered By
Type
Total Event Count per
Software Module
Event Activity