Solare Datensysteme Solar-Log User Manual
Page 31
31
Operating via a web browser within your own network
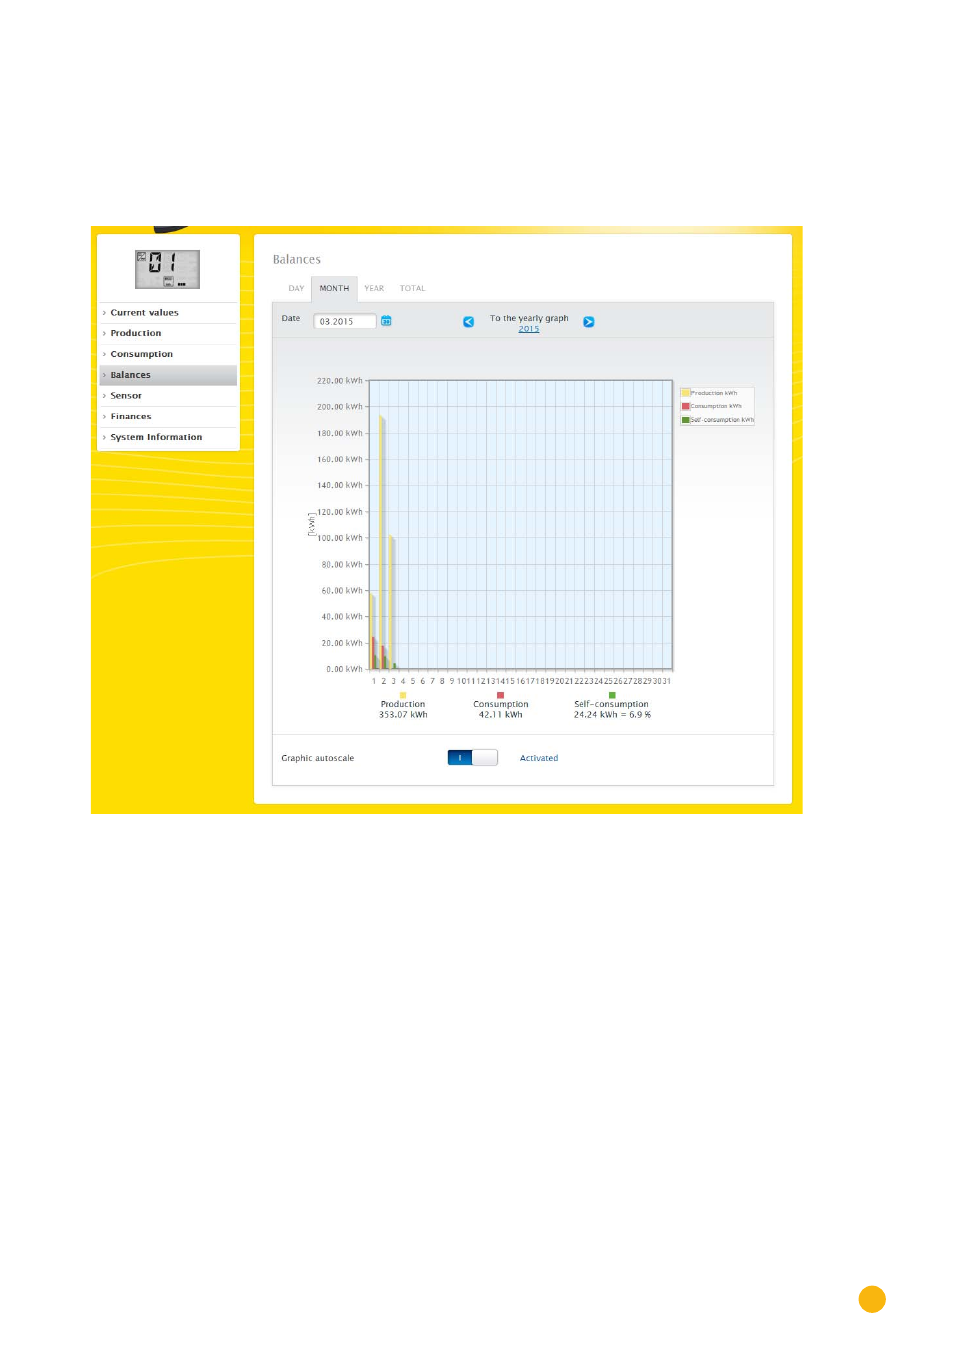
2�7�2 Month balance
The
Month
tab under balances displays the production and consumption side-by-side in a bar graph.
•
Move the mouse above one of the bars to view either the daily yield or consumption.
•
Click on one of the bars to go to the corresponding day view.
Fig.: Month view balance graph