Solare Datensysteme Solar-Log User Manual
Page 20
20
Operating via a web browser within your own network
2�5�2 Month view
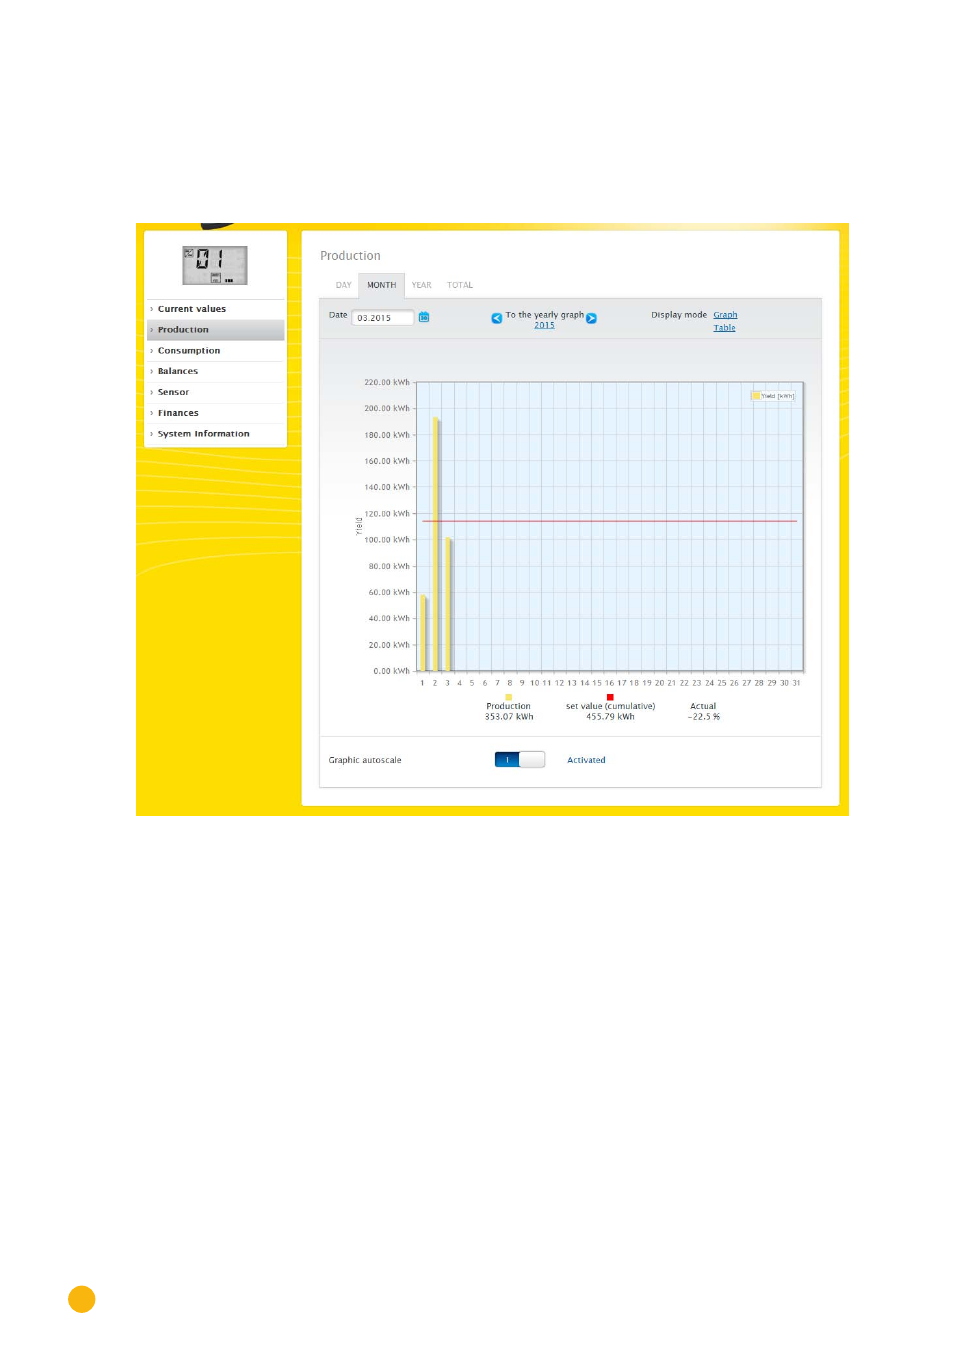
The tab
Month
displays the daily yields from the month as a total in a bar graph.
•
The daily yield can be displayed by moving the mouse above one of the bars.
•
Click on a bar to go to the corresponding day view.
Fig.: Month view production graph