Solare Datensysteme Solar-Log User Manual
Page 144
144
Using the Solar-Log™ App iPhone V3 for iPhones
9�5 The bottom menu bar
The following items can be selected from the bottom menu bar:
•
Day
•
Month
•
Year
•
Total
•
CO2
•
Plant
9�5�1 Daily Overview
1.
Tap the screen.
•
The bottom menu bar is displayed.
2. Select Day to go to the Daily Values.
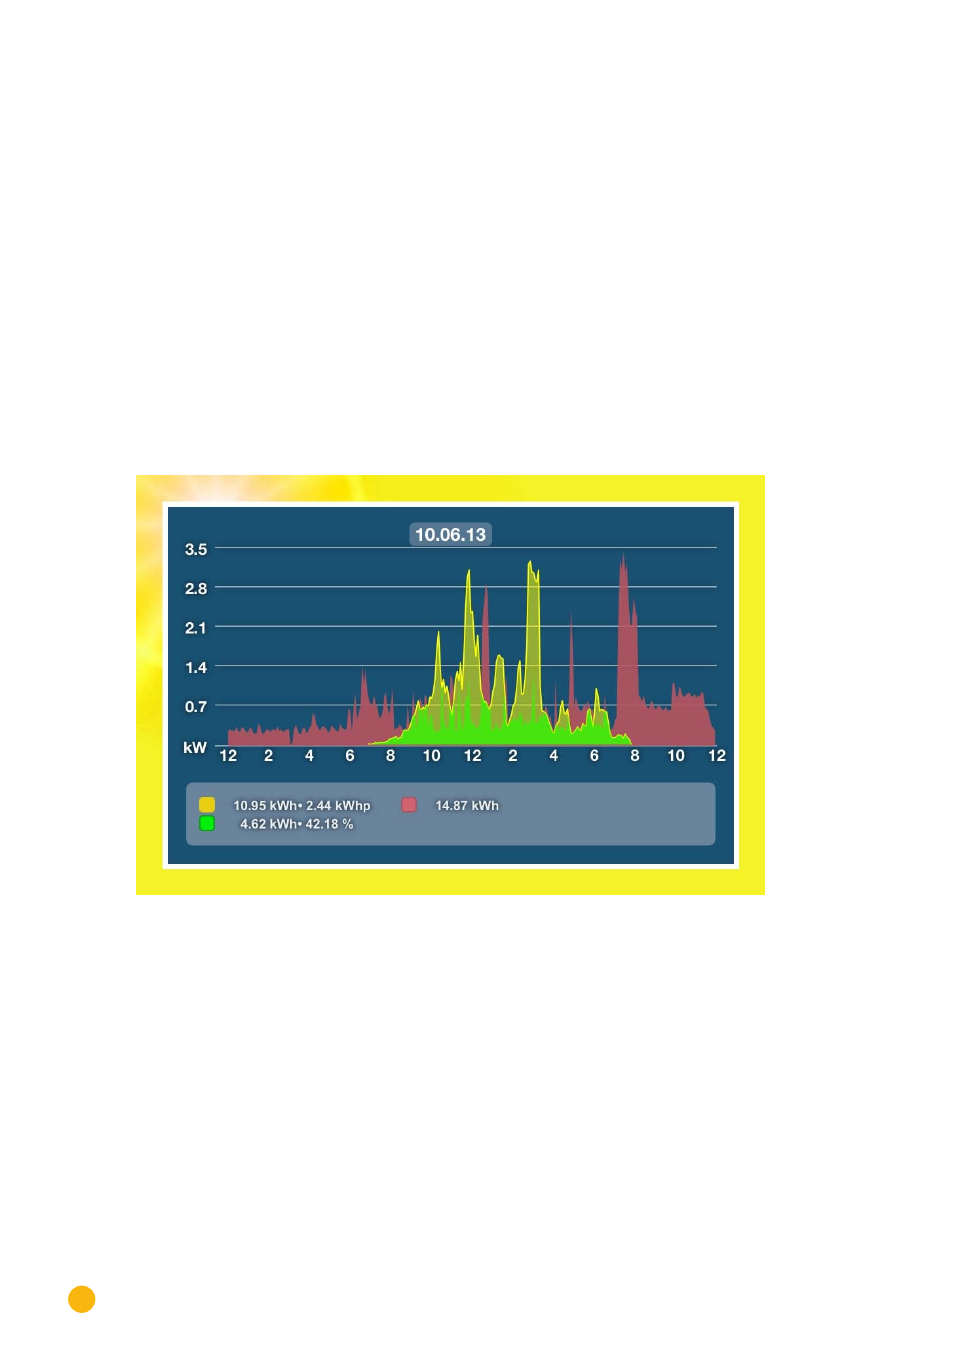
Fig.: Day curve - horizontal format
The daily yields are displayed as a graphical curve.
1.
Rotate the iOS device horizontally for a better view.
2. Swipe to the left to go to the next view or to the right to go back to the previous view.
3. Swipe up or down to change the module views.