2�5 production – Solare Datensysteme Solar-Log User Manual
Page 17
17
Operating via a web browser within your own network
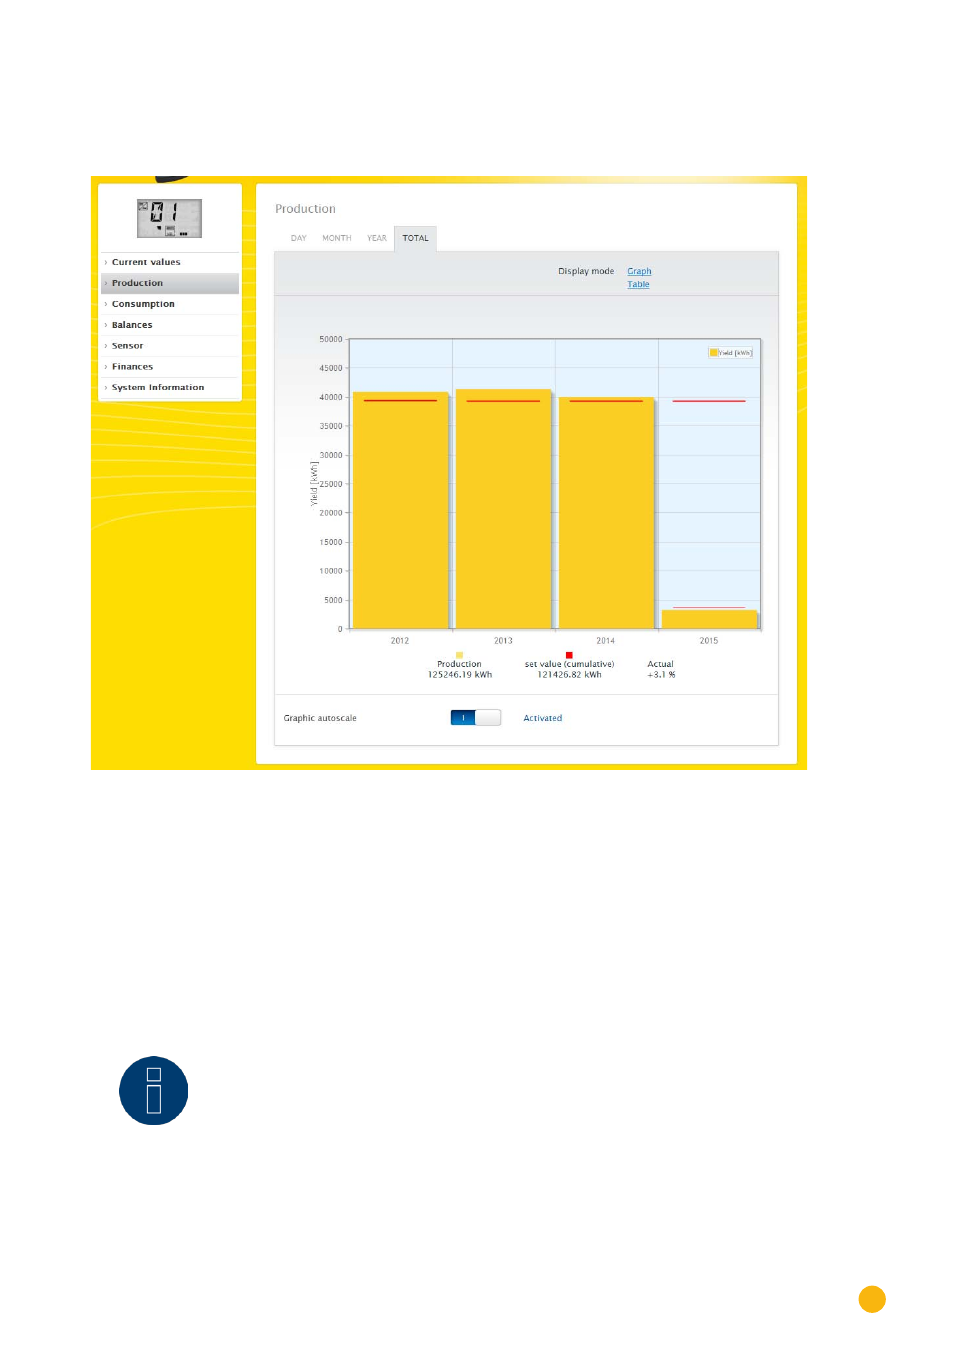
2�5 Production
You can select a graphic display of your plant's production from the
Production
menu.
Fig.: Graphic display of the plant's total production
From this display, you can select the following tabs:
•
Day
•
Month
•
Year
•
Total
You can select to display the view as a
graph
or
table
. The values displayed in the graph or table depend
on the view selected.
Note
!
The auto scaling option always scales the graphics up as much as possible in the
yield data section. The auto scaling can be manually disabled for the respective
graphics. Then the scaling is done based on the value defined in the device config-
uration. Please refer to the the chapter on configuring inverters in the Installation
Manual.