Solare Datensysteme Solar-Log User Manual
Page 114
114
Using Solar-Log WEB
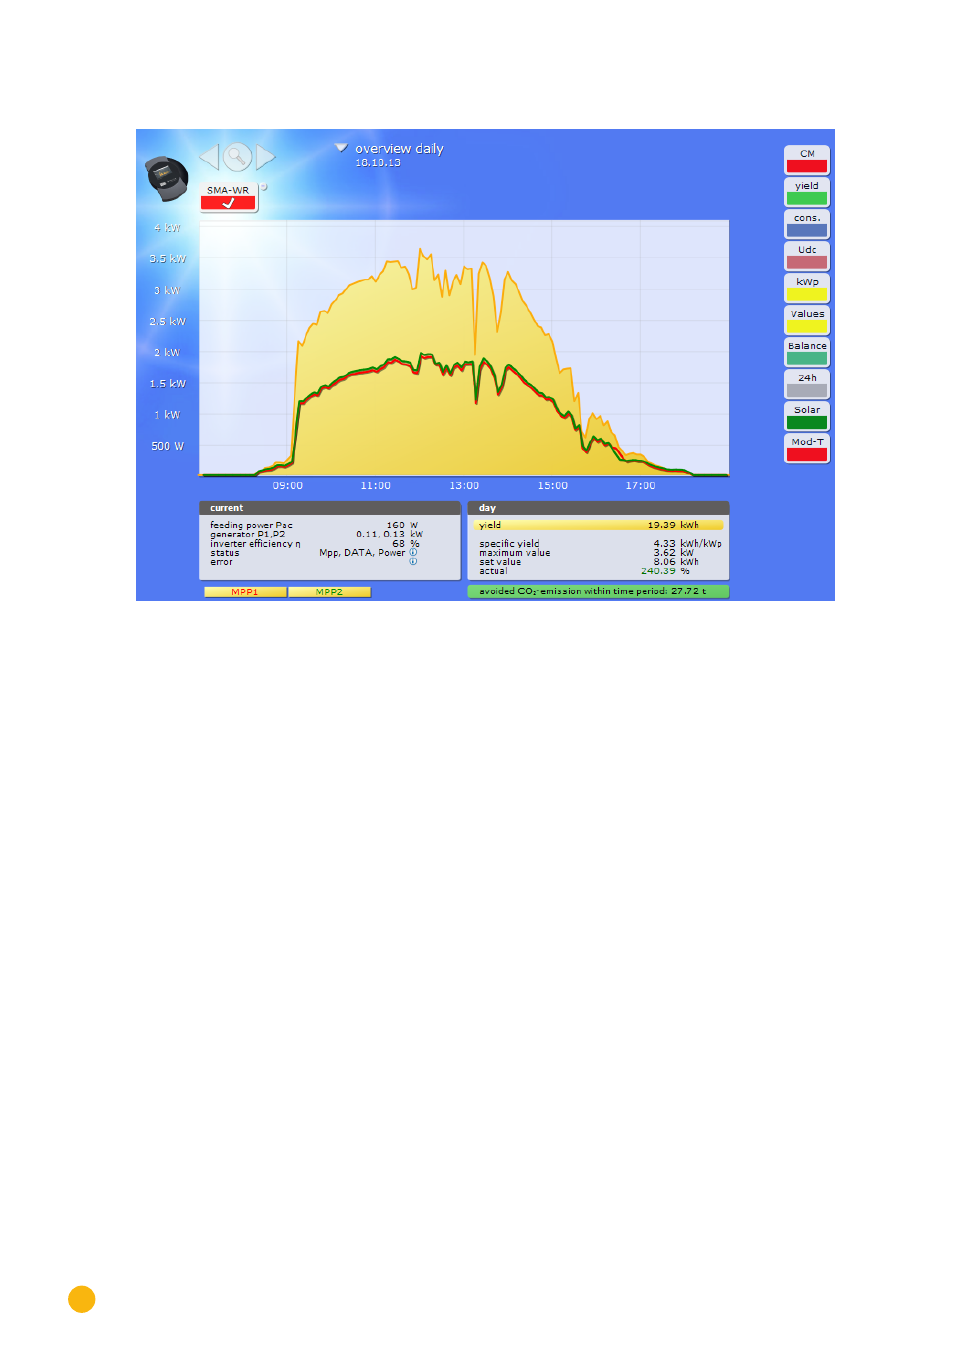
The graphic overview of the plant is displayed.
Fig.: C2 plant with a day curve
The graphic overview displays additional options that can be selected for your plant, such as current value,
day yield and any fault notifications if present.
Create a bookmark in your browser for faster access to the plant details.