AMETEK MX CTSH User Manual
Page 70
California Instruments
Revision H
70
User Manual
MX Series CTSH Compliance Test System
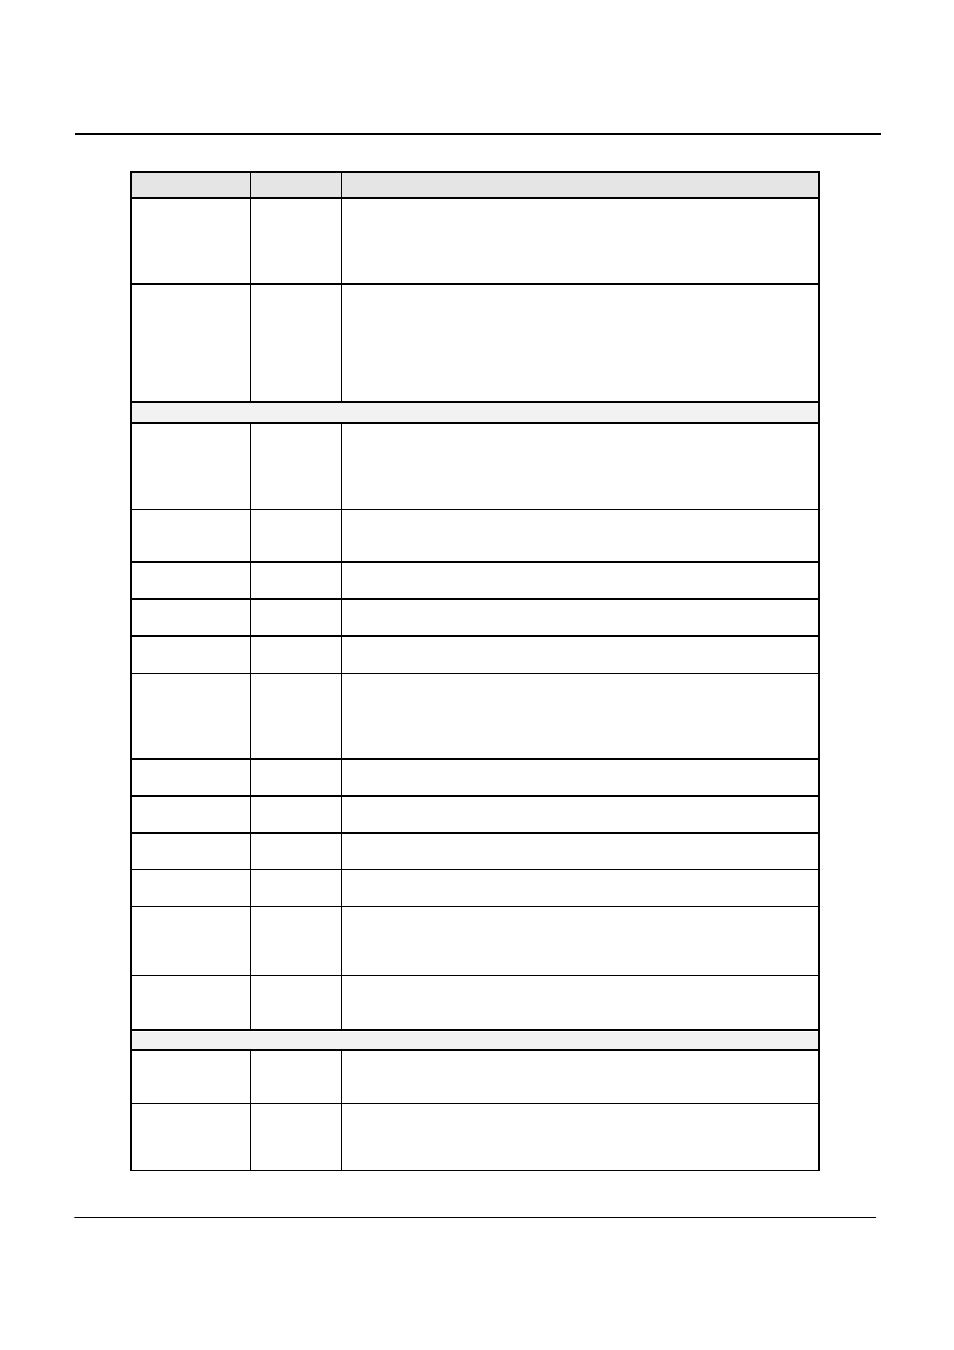
Field / Control
Location
Description
Report button
Upper left
corner
The Print Summary button generates a test report in an MS Word doc file.
This report contains both the voltage and current waveform and the
harmonics display graph. It also includes the current and voltage
harmonics in absolute values and as a percentage of the applied IEC
limits.
Power
Buttons
Upper left
corner
These button controls may be used to turn the AC power source output on
or off. The configuration can be set to use automatic power on/off,
automatic on / manual off or manual on and off control of the AC source. If
no AC source control option is selected, the operator has to use the front
panel of the AC source instead and this button will not be available. In
manual mode, the operator must click on the Power On button to turn on
power to the EUT.
WINDOW
DATA
The data in the Window Data frame on the left side of the main harmonics
screen applies to successive acquisition buffers. Acquisition buffers are
320 ms for 50 Hz EUT’s and 266.67 ms for 60 Hz EUT’s if the 16 Cycle
window size is selected. If the 10/12 cycle window size is selected, the
buffer size is 200 msec.
Frequency - Hz
Left panel
Displays the AC signal frequency in Hz. If the frequency is not 50 or 60
HZ, “F???” will appear in the field of VTHD and Source Qual. The test will
continue however but the results may not be valid.
Voltage - RMS
Left panel
Displays the Root Mean Square voltage of the AC source output for each
acquisition buffer.
Current - RMS
Left panel
Displays the Root Mean Square current to the EUT for each acquisition
window.
I peak
Left panel
Displays the peak current value of the EUT current. If the EUT produces
no harmonic currents, the peak current is
√
2 times the RMS current.
I Fund
Left panel
Displays the value of the fundamental current of the EUT for each
acquisition window. The fundamental current is the current at 50 Hz or 60
Hz only, without any contributions from higher order harmonic currents. If
the EUT produces no harmonic currents, the fundamental current will be
the same as the rms current.
Crest Factor
Left panel
Displays the crest factor of the EUT current. Crest factor is the ratio
between the peak current and the RMS current.
VA Power
Left panel
Displays the apparent power consumption of the EUT for each acquisition
window.
Power - Watts
Left panel
Displays the real power consumption of the EUT for each acquisition
window.
Power Factor
Left panel
Displays the ratio between real power and VA power of the EUT for each
acquisition window.
Window Result
Left panel
Indicates if the present acquisition buffer current harmonics exceed the
selected EUT current limits. If one or more acquisition buffers report a
failure, the overall test result will fail. This field will typically toggle
between good and fail during the test run.
VTHD
Left panel
Provides information on the AC voltage distortion. If the source voltage is
affected by the EUT harmonics currents, distortion compensation will be
used and indicated in this field.
Test Number
Bottom Left
Each test run is assigned a sequential test number. The number for the
current test is displayed in this field. This allows individual test results to
be tracked.
Test Result
Bottom Left
This field provides a visual indication of the test result. A Green field with
Pass indicates the EUT current harmonics are below the limit, a Red field
with Fail indicates the EUT current harmonics are above the limit. Note
that the condition of this field is affected by the user selected test margin.