Casio ClassPad 300 PLUS User Manual
Page 653
20050501
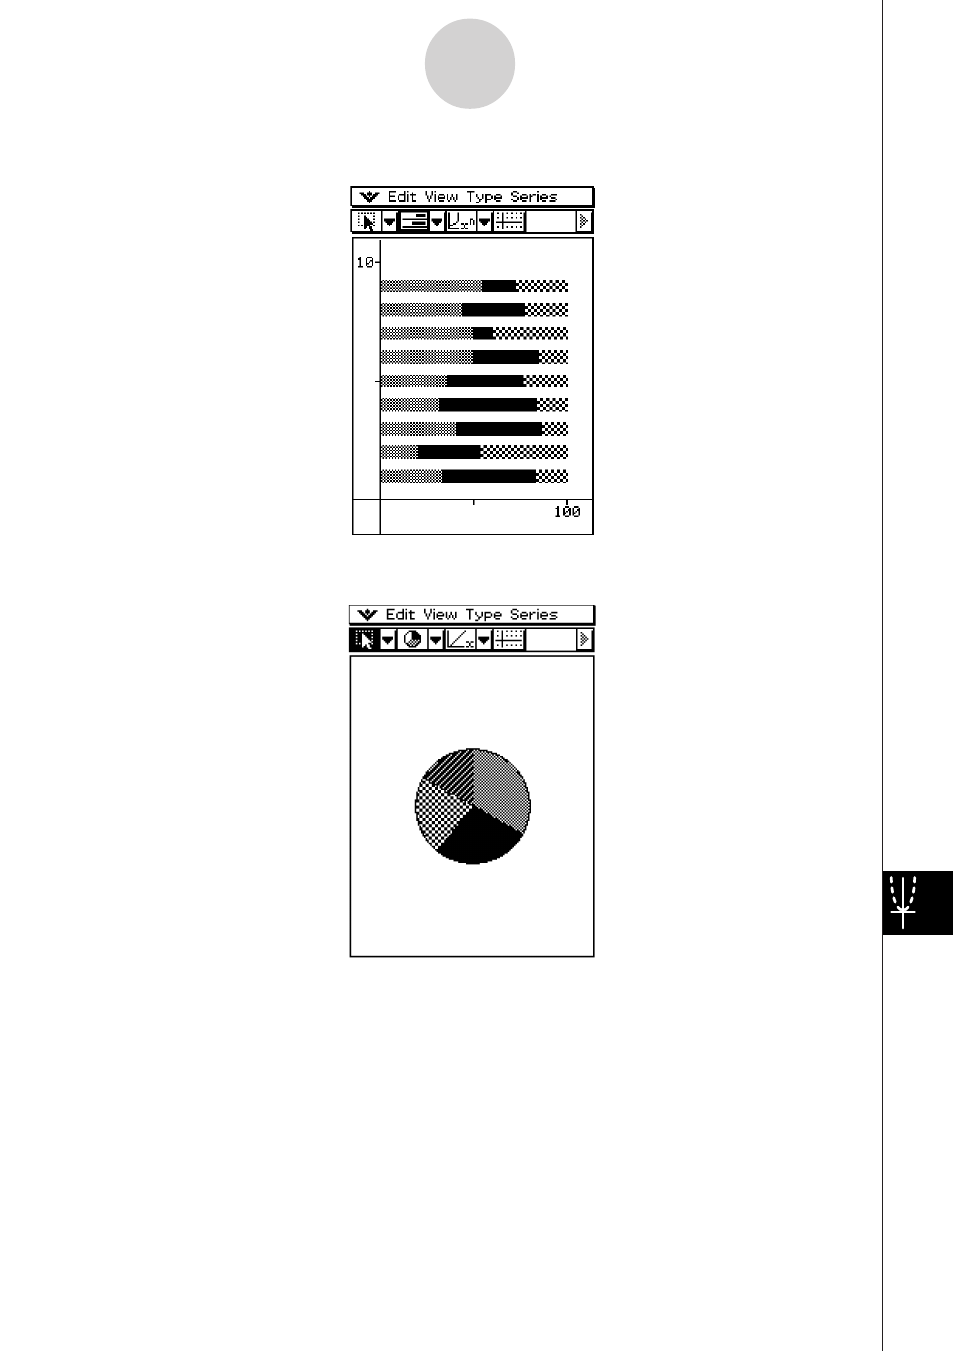
u [Graph] - [Bar] - [100% Stacked] ( " )
u [Graph] - [Pie] ( Z )
• When you select a pie chart, only the first series (row or column) of the selected data is
used.
• Tapping any of the sections of a pie graph causes three values to appear at the bottom of
the screen: the cell location, a data value for the section, and a percent value that indicates
the portion of the total data that the data value represents.
13-8-6
Graphing
This manual is related to the following products: