Casio ClassPad 300 PLUS User Manual
Page 242
20050501
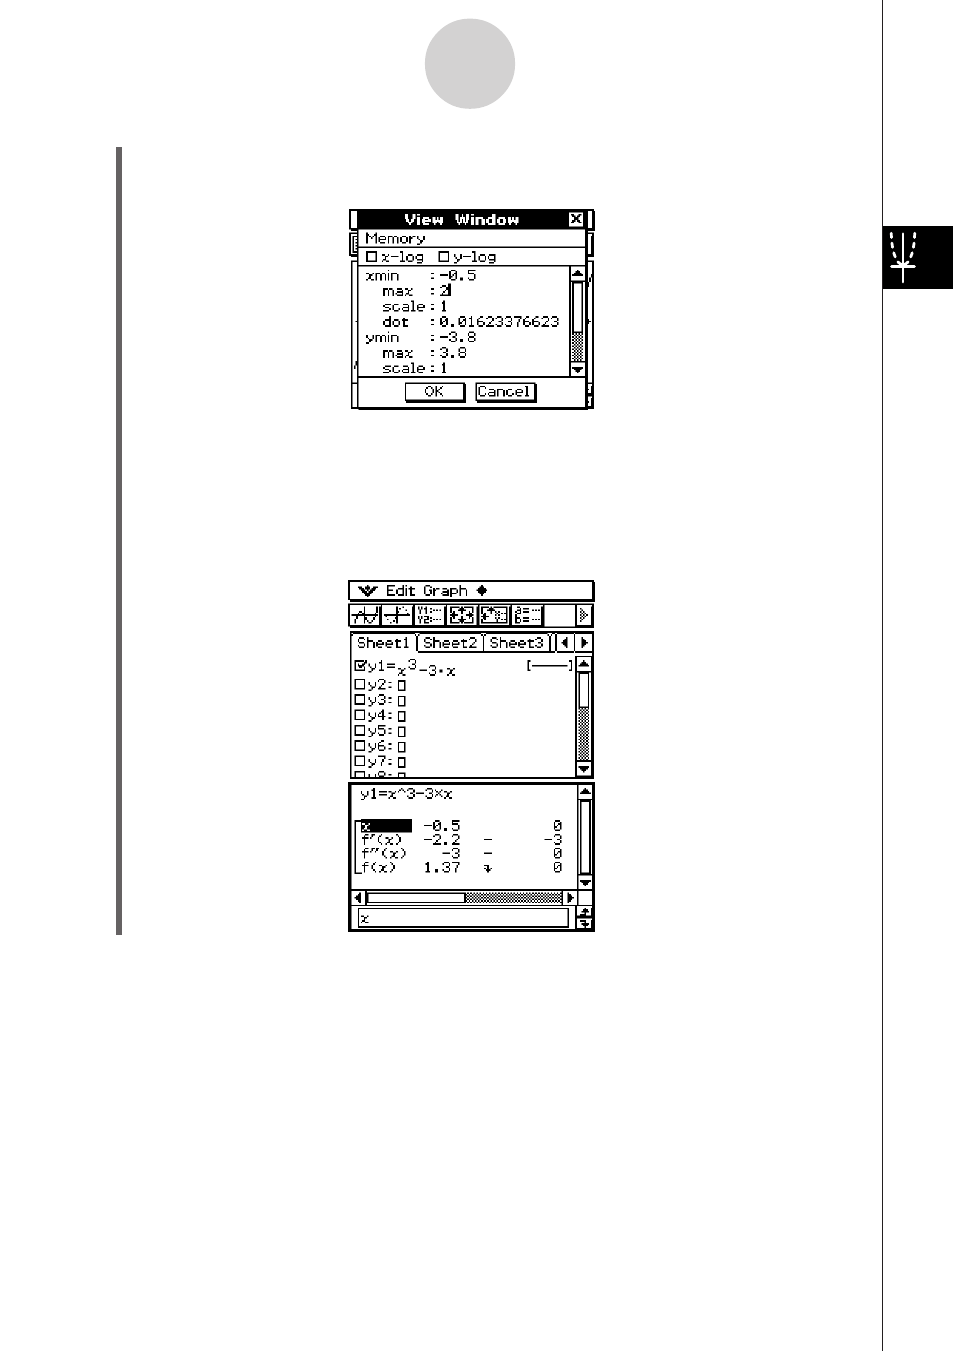
• For this example, we will specify xmin = –0.5 and xmax = 2.
(5) Tap the [OK] button to close the View Window dialog box.
(6) Tap 4.
• This starts the summary table generation using the range you specified in step (4),
and displays the result on the Table window.
(4) Specify the
x
-values for the summary table by specifying values for the [xmin] and
[xmax] settings.
3-4-13
Using Table & Graph
Important!
• A monotone increasing function or other special function may not be solvable by the
ClassPad’s internal summary table calculation. If this happens, use the procedure under
“Generating a Summary Table by Specifying All of the Values for
x
” (page 3-4-14) to
calculate the elements of the summary table. In addition to View Window parameters, you
can also select previously stored list data to specify the range of a summary table. On the
Basic Format dialog box (displayed using the [Setup] menu), select the [Cell] tab, click the
“Summary Table” down arrow button, and then select the name of the list you want to use
on the menu that appears.
20030201
20030401