Casio – Casio FX-CG10 User Manual
Page 210
CASIO
6-17
Cubic regression
Model formula .......
y
=
ax
3
+
bx
2
+
cx
+
d
a
.......... regression third coefficient
b
.......... regression second coefficient
c
.......... regression first coefficient
d
.......... regression constant term
(
y
-intercept)
Quadratic regression
Model formula .......
y
=
ax
2
+
bx
+
c
a
.......... regression second coefficient
b
.......... regression first coefficient
c
.......... regression constant term
(
y
-intercept)
k Med-Med Graph
When it is suspected that there are a number of extreme values, a Med-Med graph can be
used in place of the least squares method. This is similar to linear regression, but it minimizes
the effects of extreme values.
1(CALC) 3(Med)
6(DRAW)
The following is the Med-Med graph model formula.
y
=
ax
+
b
a
.............. Med-Med graph slope
b
.............. Med-Med graph
y
-intercept
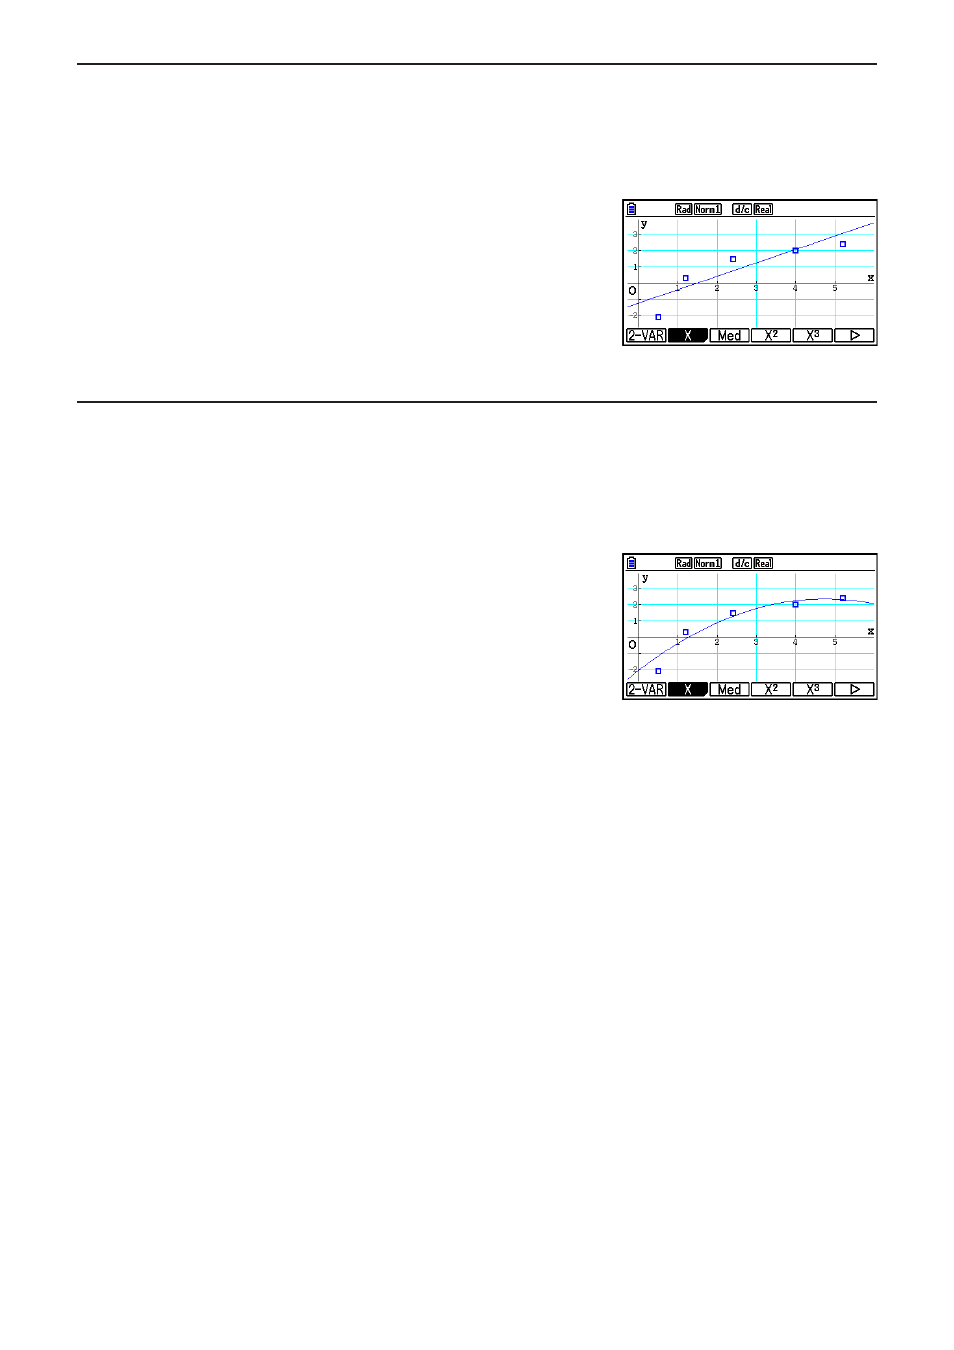
k Quadratic/Cubic/Quartic Regression Graph
A quadratic/cubic/quartic regression graph represents connection of the data points of a
scatter diagram. It uses the method of least squares to draw a curve that passes close to
as many data points as possible. The formula that represents this is quadratic/cubic/quartic
regression.
Ex. Quadratic regression
1(CALC) 4(X
2
)
6(DRAW)
Quartic regression
Model formula .......
y
=
ax
4
+
bx
3
+
cx
2
+
dx
+
e
a
.......... regression fourth coefficient
b
.......... regression third coefficient
c
.......... regression second coefficient
d
.......... regression first coefficient
e
.......... regression constant term (
y
-intercept)