Casio – Casio FX-CG10 User Manual
Page 185
CASIO
5-53
• Pressing
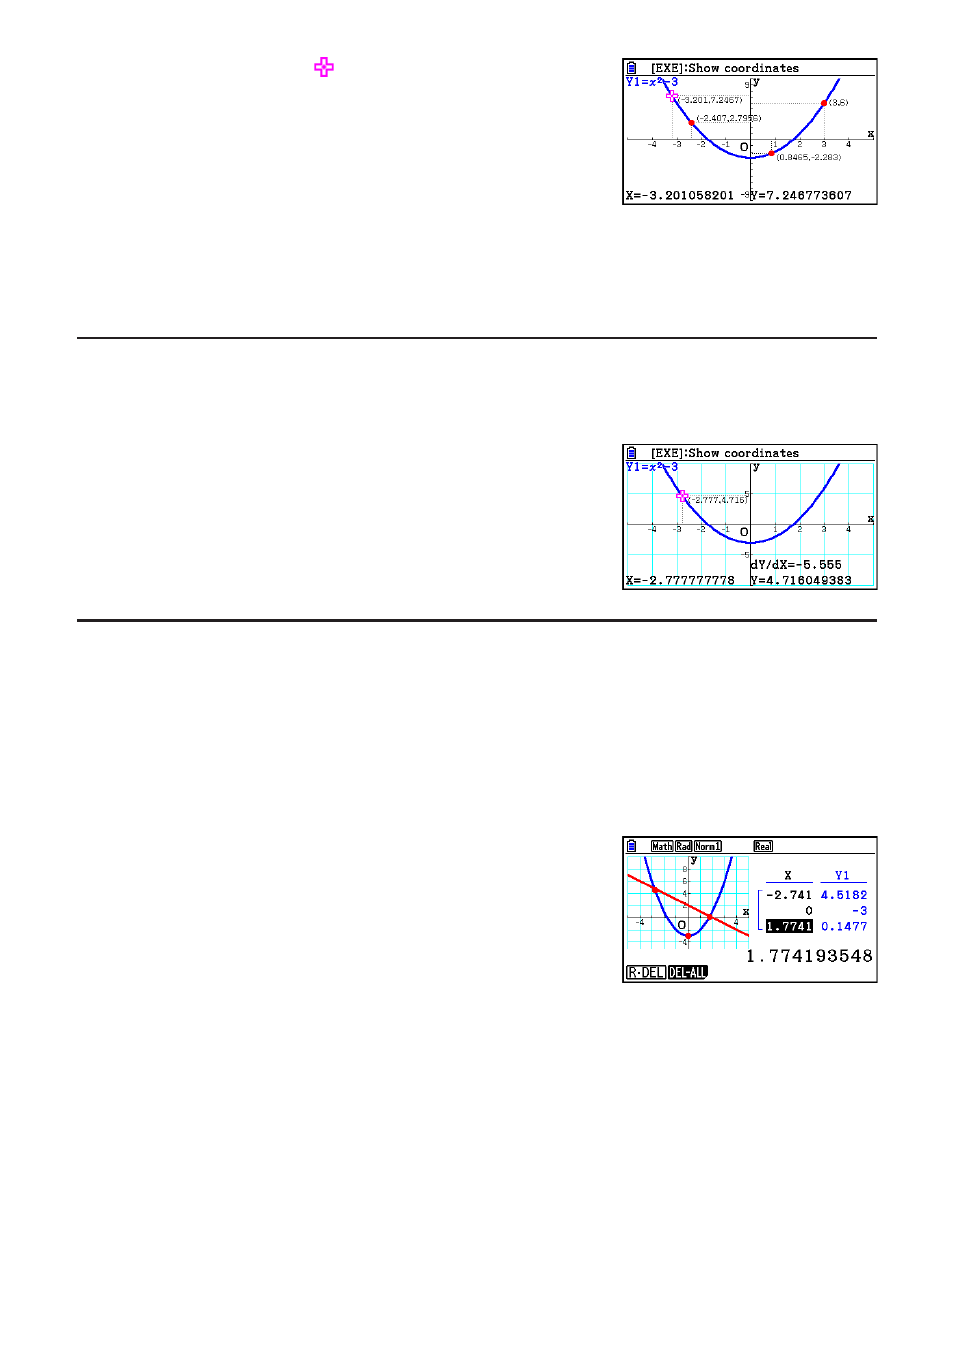
w while the pointer is on a graph (during
Trace, G-Solve, etc.) will place a dot at the pointer location
along with a label which shows the coordinates at the dot
location. Pressing
aD removes the last dot and
coordinate label that was created.
• Dots created with the above operation will appear as
᭹
for coordinate values that are
included in the graph expression, and
᭺
for values that are not. For example, a dot at
coordinates (2,1) on the graph Y=2X will be
᭹
, while a dot at coordinates (2,1) on the graph
Y>2X will be
᭺
.
k Displaying the Derivative
In addition to using Trace to display coordinates, you can also display the derivative at the
current pointer location.
1. From the Main Menu, enter the Graph mode.
2. On the Setup screen, specify “On” for “Derivative”.
3. Draw the graph.
4. Press
!1(TRACE), and the pointer appears at the
center of the graph. The current coordinates and the
derivative also appear on the display at this time.
k Graph to Table
You can use trace to read the coordinates of a graph and store them in a number table. You
can also use Dual Graph to simultaneously store the graph and number table, making this an
important graph analysis tool.
1. From the Main Menu, enter the Graph mode.
2. On the Setup screen, specify “GtoT” for “Dual Screen”.
3. Configure V-Window settings.
4. Save the function and draw the graph on the
main (left) screen.
5. Activate Trace. When there are multiple graphs on
the display, press
f and c to select the graph you
want.
6. Use
d and e to move the pointer and press w to store coordinates into the number
table. Repeat this step to store as many values as you want.
• Each press of
w places a dot on the graph at the current pointer location.
7. Press
K1(CHANGE) to make the number table active.