Metrohm 763 PVC Thermomat Manual User Manual
Page 36
3.2 Results
763 PVC Thermomat
29
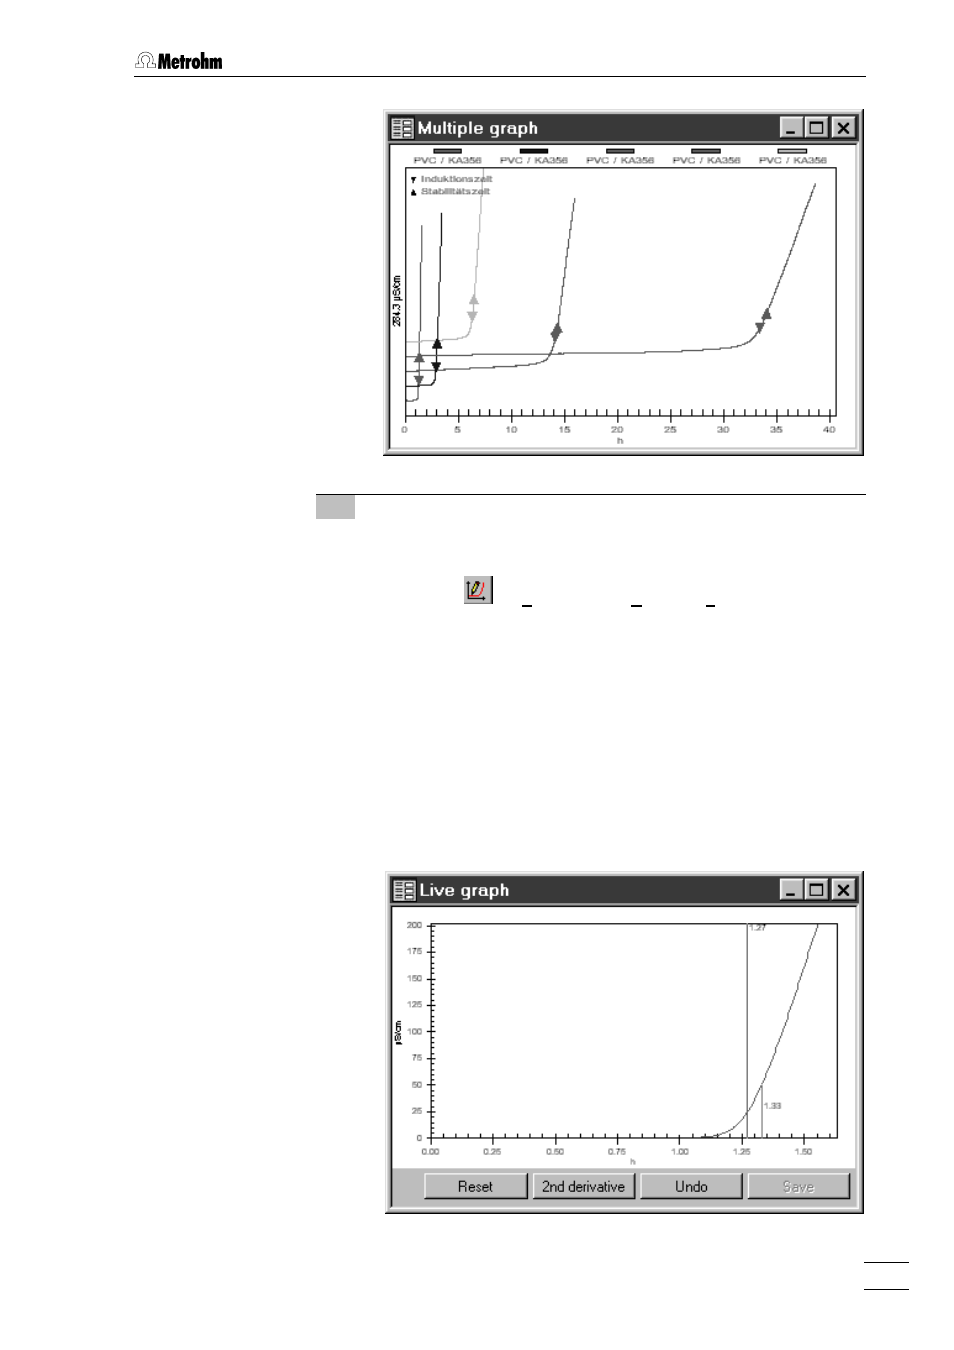
3 Open live graph
⇒
Mark the determination in the determination overview whose
curve is to be displayed.
⇒
Click on
or
Determination / Graphics / Live graph with
reevaluation
in the results window. A new window is opened in
which the measuring curve of the marked determination is
shown. If a different determination is marked in the determi-
nation overview then the curve is automatically updated. If
present then the determined
Induction time
(red vertical line
and numbers) and
Stability time
(black vertical line and num-
bers) will be shown in the graphics window as well as the
measuring curve (green). With
<2nd derivative>
the second
derivative of the measuring curve can be shown as a blue
line. The live graph offers the possibility of the manual
ree-
valuation
of the measuring curves (see section 4.7.3).
- 915 KF Ti-Touch (382 pages)
- 800 Dosino (53 pages)
- 767 Calibrated Reference (23 pages)
- 940 Professional IC Vario ONE/SeS/Prep 2 (54 pages)
- 754 Dialysis Unit (49 pages)
- 815 Robotic Soliprep for LC (76 pages)
- Vision Manual (207 pages)
- tiamo 2.1 Manual (1532 pages)
- 825 Lab Link (37 pages)
- 808 Titrando (70 pages)
- 902 Titrando (52 pages)
- 756 KF Coulometer (163 pages)
- 756 KF Coulometer (162 pages)
- 940 Professional IC Vario ONE/LPG (98 pages)
- 850 Professional IC Anion MCS Prep 3 (154 pages)
- 850 Professional IC Anion MCS Prep 3 (152 pages)
- 904 Titrando (58 pages)
- 850 Professional IC Anion MSM-HC MCS Prep 2 (150 pages)
- 930 Compact IC Flex Oven/ChS/Deg (47 pages)
- 872 Extension Module Liquid handling (64 pages)
- 814 USB Sample Processor (90 pages)
- 814 USB Sample Processor (91 pages)
- 940 Professional IC Vario (43 pages)
- Vision – Tutorial (40 pages)
- 799 GPT Titrino (242 pages)
- 889 IC Sample Center (68 pages)
- 761 Compact IC (228 pages)
- 851 Titrando (100 pages)
- 748 DH Sample Changer (32 pages)
- 940 Professional IC Vario ONE/SeS/HPG (51 pages)
- 896 Professional Detector – Amperometry (62 pages)
- 877 Titrino plus (139 pages)
- 881 Compact IC pro – Anion (129 pages)
- 940 Professional IC Vario ONE/ChS/HPG (112 pages)
- 930 Compact IC Flex Deg (41 pages)
- 840 PC Control 5.0 / Touch Control (351 pages)
- 940 Professional IC Vario ONE/Prep 1 (45 pages)
- 776 Dosimat (42 pages)
- 717 Sample Changer (36 pages)
- 815 Robotic USB Sample Processor XL (113 pages)
- 815 Robotic USB Sample Processor XL (114 pages)
- 940 Professional IC Vario ONE/SeS/PP (126 pages)
- 838 Advanced Sample Processor Installation Instructions (109 pages)
- 700 Dosino (55 pages)
- 719 S Titrino (152 pages)