Eppendorf R Series 48R CO2 Incubator User Manual
Page 28
28
CO48R-0050
Galaxy R Series 48 R Personal Size CO
2
Incubator
User’s Guide
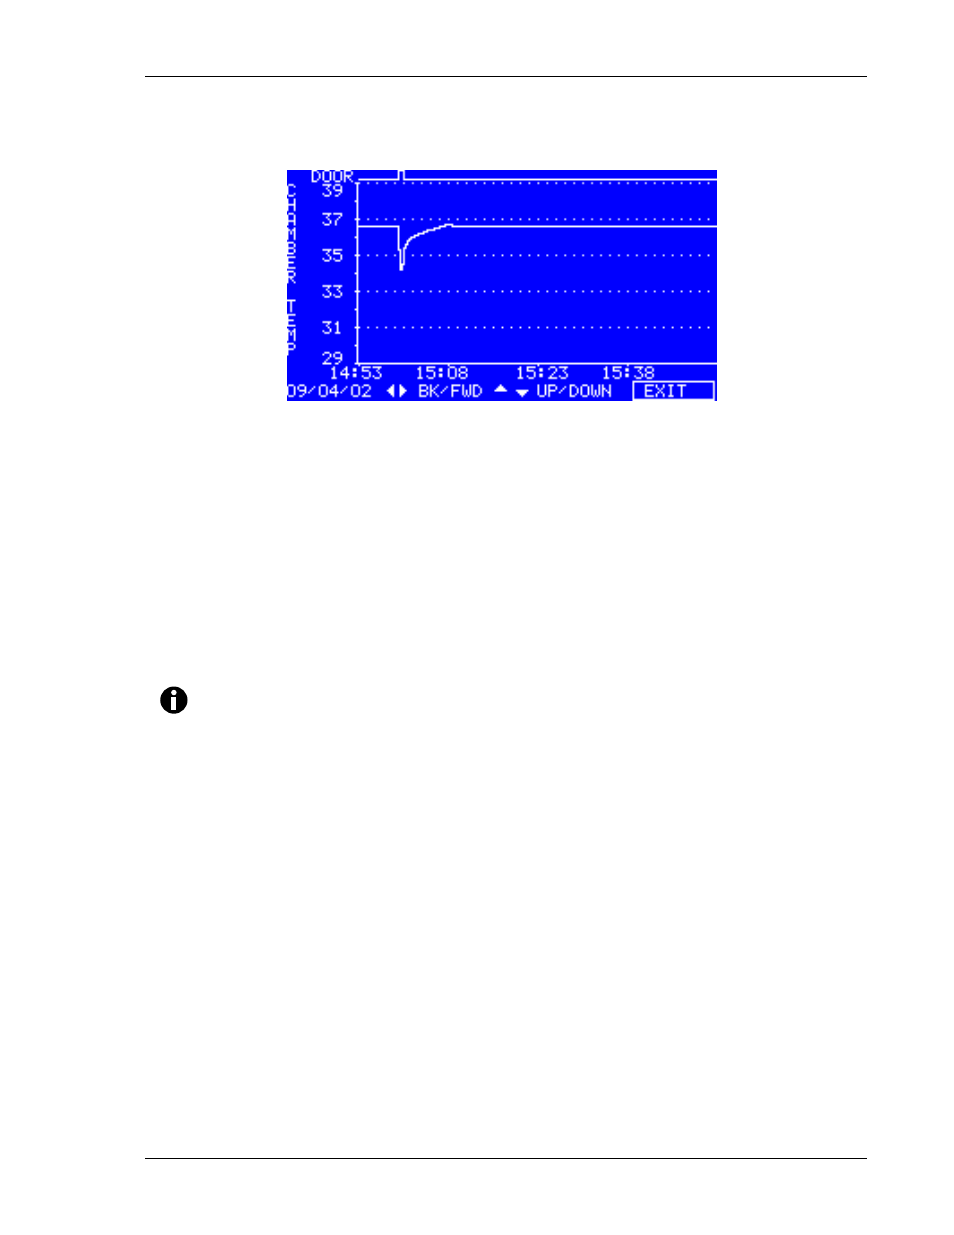
Figure 10: TEMPERATURE GRAPH +
DOOR OPEN BAR CHART Screen
Compressing data allows memory space to be maximized. Once the memory
space has been filled, the earliest events are overwritten as they are replaced by
the latest recording. Graphical recording can be extended, however, to a
number of years if your incubator is equipped with an RS-232 port, by
connecting the port to a PC loaded with InnovaLog Software (see Section 7.2).
3.7.3
CO
2
GRAPH
+
DOOR
OPEN
BAR
CHART
These graphs record in a way similar to the Chamber Temperature graphs.
The specification for CO
2
is ± 0.1%.
NOTE:
Both CO
2
and Temperature graphs share the same time axis. If the time
axis changes to accommodate data in one graph, it will also change in the
other.
3.7.4
DIAGNOSTIC
CHAMBER
ELEMENT
GRAPH
This graph records chamber element temperature over time to assist
troubleshooting.
3.7.5
DIAGNOSTIC
DOOR
GRAPH
This graph records the door’s inner surface temperature over time to assist
troubleshooting.