Colors menu, Using the browse window – DAVIS GroWeatherLink Software User Manual
Page 85
U
S I N G
T H E
S
O F T W A R E
Using the Browse Window
78
▲
Choose Line/Bar
To select either a bar or line graph, choose Choose Line/Bar for the desired
axis. A pop-up list appears next to the Line/Bar button. Choose either Line or
Bar from the list.
▲
Edit Title
To edit the plot title, choose Edit Title from the options menu. The software
moves the cursor to the Plot Title text box.
▲
Edit Min/Max
To edit the Min/Max setting for either axis, choose the appropriate command
from the Options menu. The software moves the cursor to the appropriate
Min/Max text box.
▲
Hide Variable Box
You may hide the Variables Box in order to maximize the size of your plot.
When the Variables Box is hidden, a check mark appears beside the menu
command. To turn this option on or off, choose Hide Variable Box from the
Options menu.
▲
Clear Plot
To clear all variables from the plot (giving you a blank plot to work with),
choose Clear Plot from the Options menu.
Colors Menu
You may change the color scheme used by the software in creating strip charts
and plots. For instructions, see “Colors Menu” on page 72.
U
S I N G
T H E
B
R O W S E
W
I N D O W
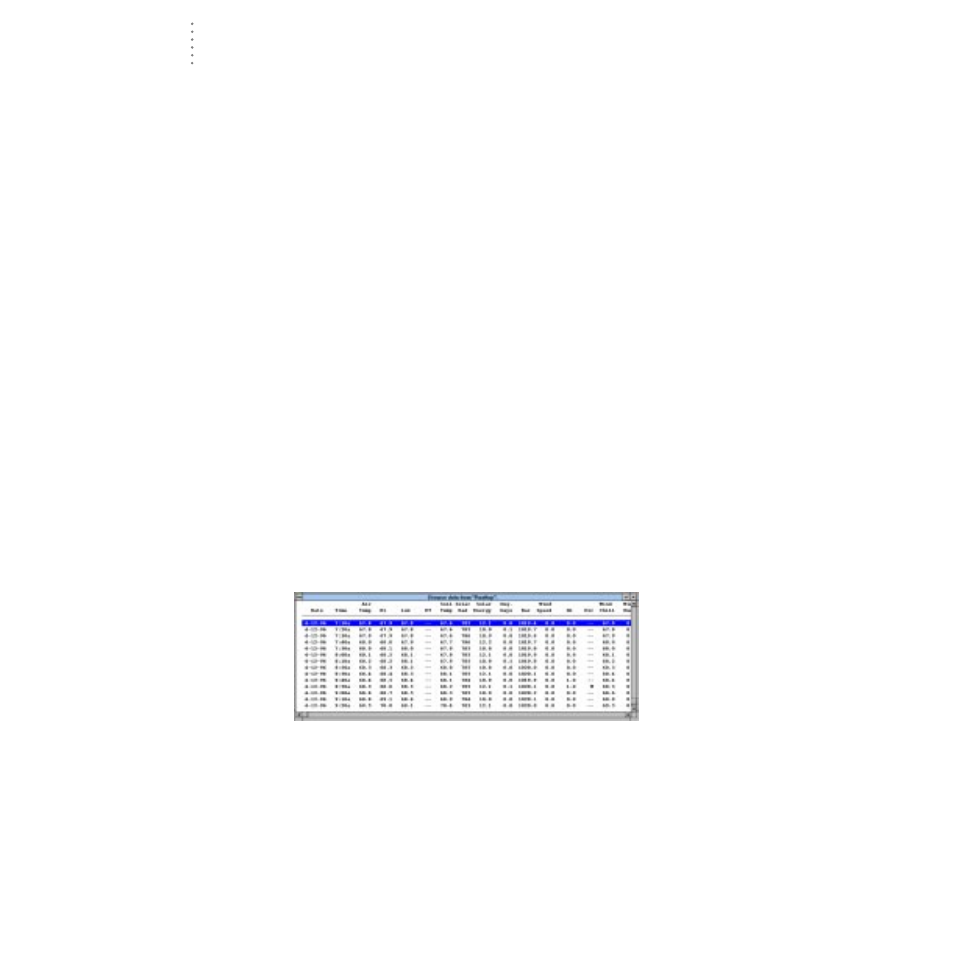
The browse window allows you to view, edit, print, annotate, and export the raw
data collected by the WeatherLink.
B
ROWSE
W
INDOW
All of the menu commands are explained in separate sections below, however
there are a several useful operations you may perform directly from the browse
window.