Add/remove menu, Span menu, Options menu – DAVIS GroWeatherLink Software User Manual
Page 84
U
S I N G
T H E
S
O F T W A R E
Using the Plot Window
77
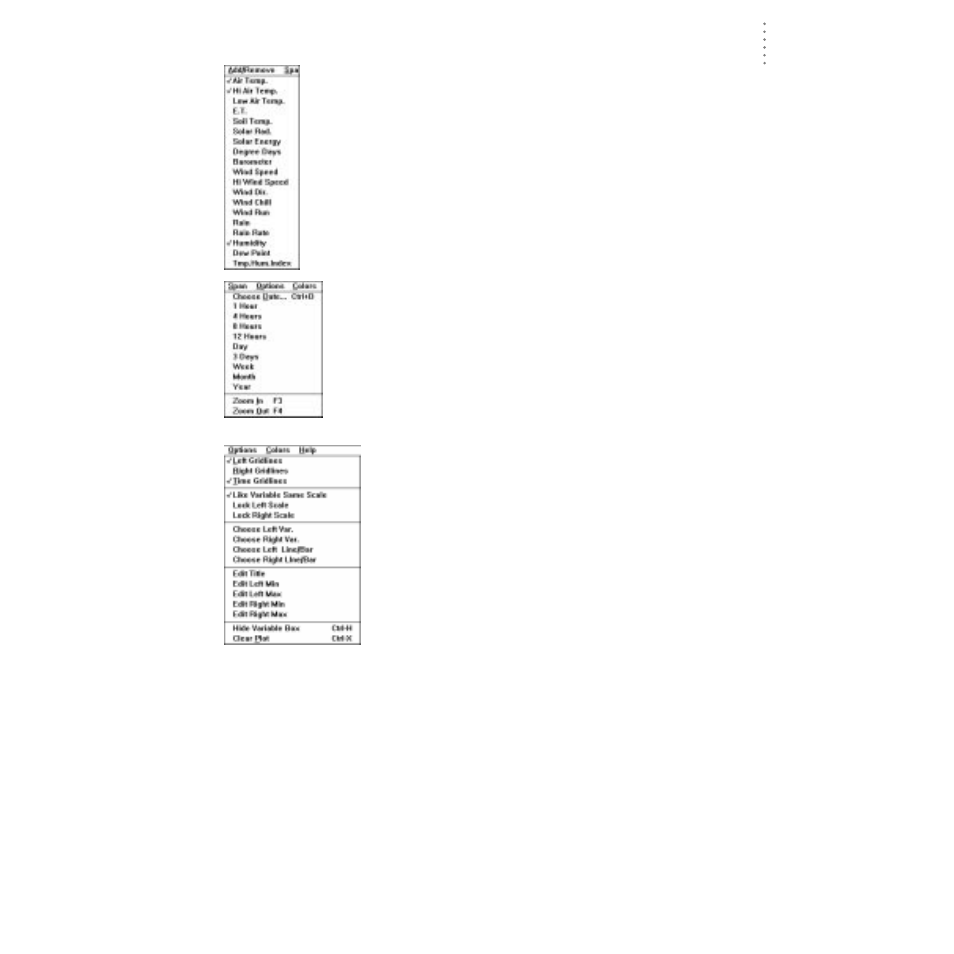
Add/Remove Menu
To add a variable to the plot, choose the variable you want to add from
the Add/Remove menu. To remove a variable from the plot, choose the
variable you want to remove from the Add/Remove menu.
Note:
Variables which are plotted have check marks next to their name.
Span Menu
To change the plot span of the plot, select the desired plot span from
the Span menu. To “zoom in” one plot span (for example, to go from
a plot span of a Week to a plot span of 3 Days), choose Zoom In from
the Span menu or press F3. To “zoom out” one plot span (for exam-
ple, to go from a plot span of 3 Days to a plot span of a Week),
choose Zoom Out from the Span menu or press F4.
Options Menu
The commands in the Options menu allow you to set a variety
of plot options.
▲
Gridlines
You may turn the gridlines on or off for the left axis, right
axis, and time axis separately. When the gridlines are on, a
check mark appears beside the menu command. To
change the gridline setting from on to off (or vice versa)
choose the appropriate command from the Options menu.
▲
Like Variable Same Scale
Turning this option on facilitates comparison of variables
which use the same unit of measure by forcing the soft-
ware to use the same scale for any variables which use the
same unit of measure. When this option is on, a check
mark appears beside the menu command. To turn this
option on or off, choose Like Variable Same Scale from the
Options menu.
▲
Lock Scale
To lock (or unlock) the axes of all plots, choose Lock Scale for the desired axis.
▲
Choose Variable
To choose the axis information you want displayed on either axis, choose
Choose Variable for the desired axis. A pop-up menu appears next to the axis
information button. Select the desired variable from the pop-up menu