DAVIS GroWeatherLink Software User Manual
Page 82
U
S I N G
T H E
S
O F T W A R E
Using the Plot Window
75
▲
Choose Line/Bar
A line plot simply plots all of the data in the database, drawing a line from one
data point to another until it fills out the whole plot span. Bar graphs, on the
other hand, show cumulative totals during a specific interval (each day on
week and month plots, each month on year plots). You may only use bar
graphs for those variables which accumulate totals (rainfall, ET, etc.) and only
on plot spans of a week, month, or year.
To select either a bar or line graph, click on the Bar/Line button. A pop-up list
appears. Choose either Bar or Line from the list.
B
AR
/L
INE
P
OP
-U
P
L
IST
▲
Set Axis Min/Max
You may set your own minimum or maximum for each axis by entering the
desired number into the Axis Min/Max text box. Setting the minimum or
maximum automatically “locks” the axis (see below).
▲
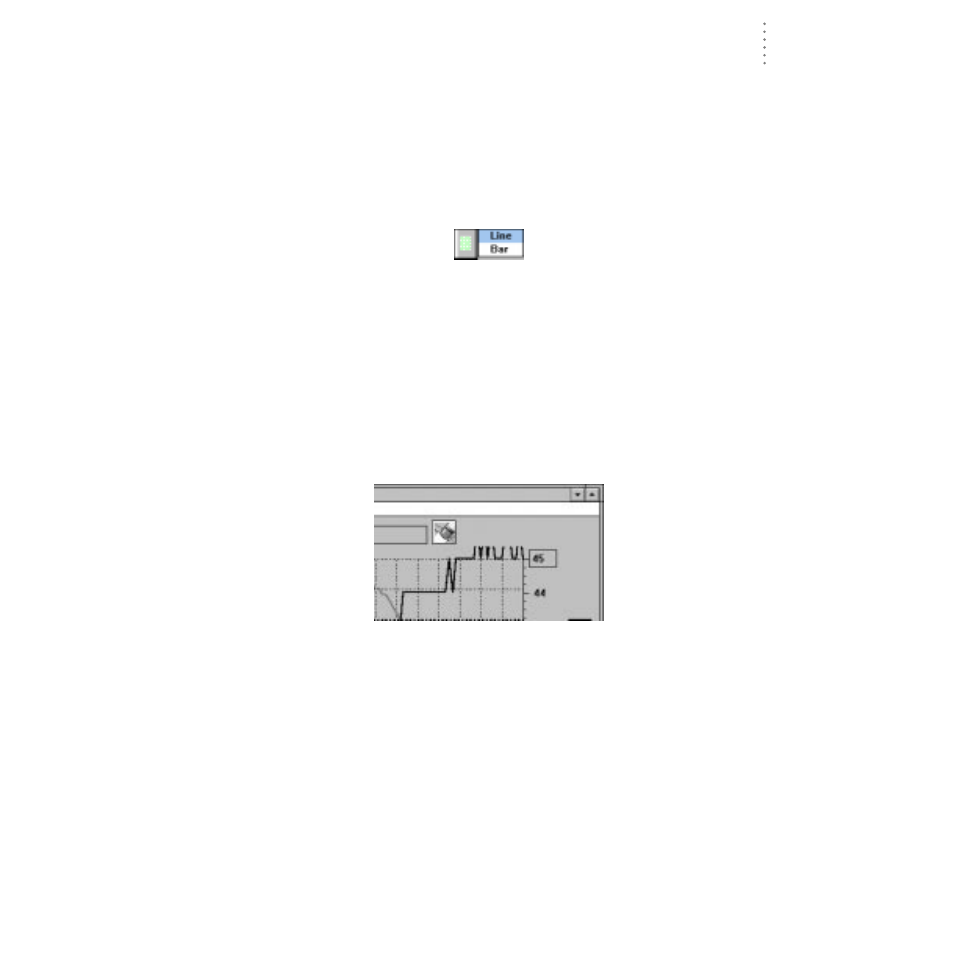
Lock Axis
To lock (or unlock) the axes of all plots, click on the Lock Axis icon for the
desired axis. Locking the axis will cause subsequent plot spans (when you
scroll through plot spans) to use the same scale as the plot span currently
being viewed. Data which falls outside of the plot scale will have the line or
bar “clipped” at the top or bottom of the plot.
C
LIPPED
D
ATA
▲
View Database Information
Double-clicking on any location in the plot will open the Browse window (see
“Using the Browse Window” on page 78) to view the raw data for that time
and date.
▲
View Details
You may click and drag on any section of a plot to view that section in more
detail (see “View Details” on page 69).
▲
Zoom In/Out
To “zoom in” one plot span (for example, to go from a plot span of a Week to a
plot span of 3 Days), click on the Zoom In icon. To “zoom out” one plot span
(for example, to go from a plot span of 3 Days to a plot span of a Week), click
on the Zoom Out icon.