Summary, Strip charts – DAVIS GroWeatherLink Software User Manual
Page 53
U
S I N G
T H E
S
O F T W A R E
Display Menu
46
▲
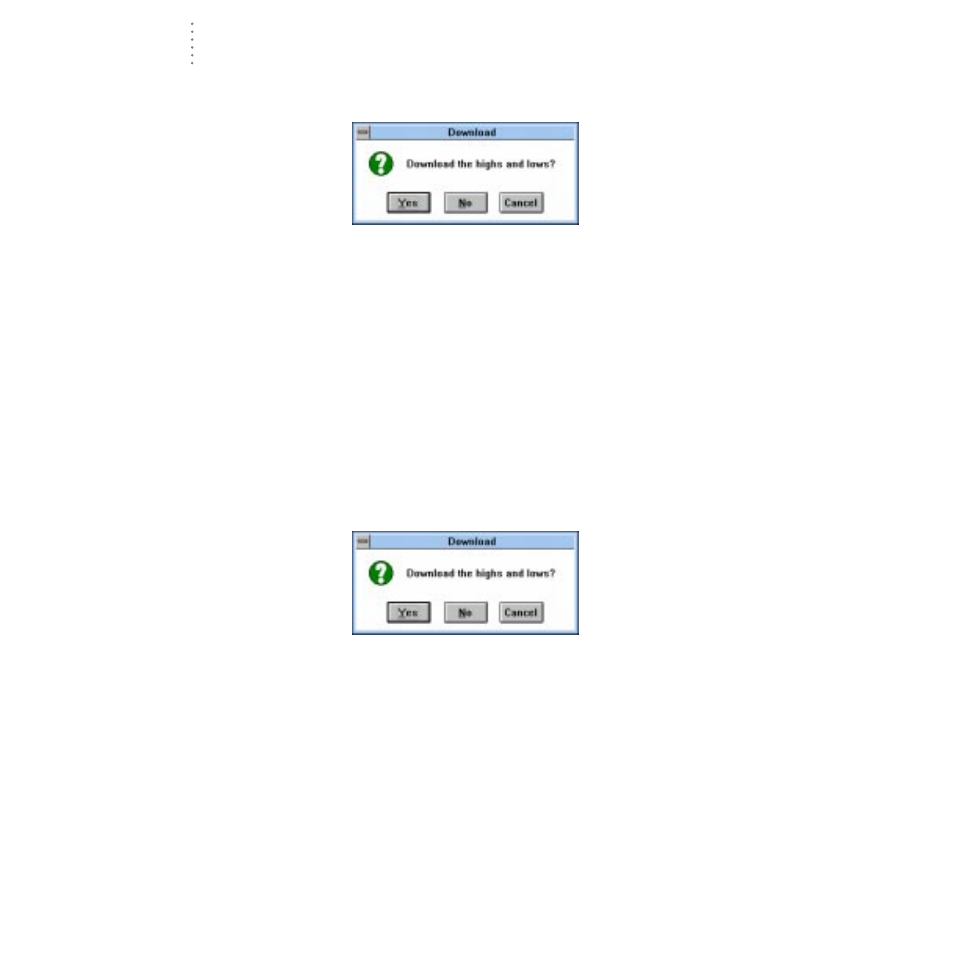
To start the bulletin, choose Bulletin from the Display menu.
The software prompts you to indicate whether you want to download highs
and lows. Choose Yes or No to continue.
D
OWNLOAD
H
IGHS
AND
L
OWS
C
ONFIRMATION
▲
To close the bulletin, double-click on the Control-menu box in the upper left corner
of the window.
▲
To print the bulletin, choose Print from the Control menu or press Ctrl-P.
Set your printer options in the Print dialog box (for best results, be sure to
choose landscape mode) and then choose OK.
Summary
The summary shows a text table of all current conditions. Also included on the
high/low summary screen are the highs and lows for each function along with
the time and date they occurred. The information on the high/low summary is
updated in the same way as the bulletin.
▲
To start the summary, choose Summary from the Display menu.
The software prompts you to indicate whether you want to download highs
and lows. Choose Yes or No to continue.
D
OWNLOAD
H
IGHS
AND
L
OWS
C
ONFIRMATION
▲
To close the summary, double-click on the Control-menu box in the upper left cor-
ner of the window.
▲
To print the summary, choose Print from the Control menu or press Ctrl-P.
Strip Charts
The strip charts offer you 4 line graphs which update in real-time as long as they
are open. You may select the data you want to plot on the strip charts and the
span over which you want it plotted.