DAVIS GroWeatherLink Software User Manual
Page 75
U
S I N G
T H E
S
O F T W A R E
Using the Strip Charts
68
▲
To add a variable to a strip chart
The first step is to select the desired strip chart (top, bottom, etc.) by clicking
on the axis button for that strip chart. Then choose the variable you want
added to the active strip chart from the Add/Remove menu. Note that any
variables already plotted on the active strip chart have check marks next to
their name.
▲
Remove Variable
The first step is to select the desired strip chart (top, bottom, etc.) by clicking
on the axis button for that strip chart. Then choose the variable you want
removed from the active strip chart from the among the variables with check
marks next to their name in the Add/Remove menu.
▲
Change Axis Information
Although you may have as many variables as desired on any strip chart, the
axis for each strip chart may only display information for one of those vari-
ables. To choose the axis information you want displayed, click on the axis
button for the desired strip chart. A pop-up menu appears, containing the
name (and color) of the variables plotted on this strip chart. Select the desired
variable from the pop-up menu.
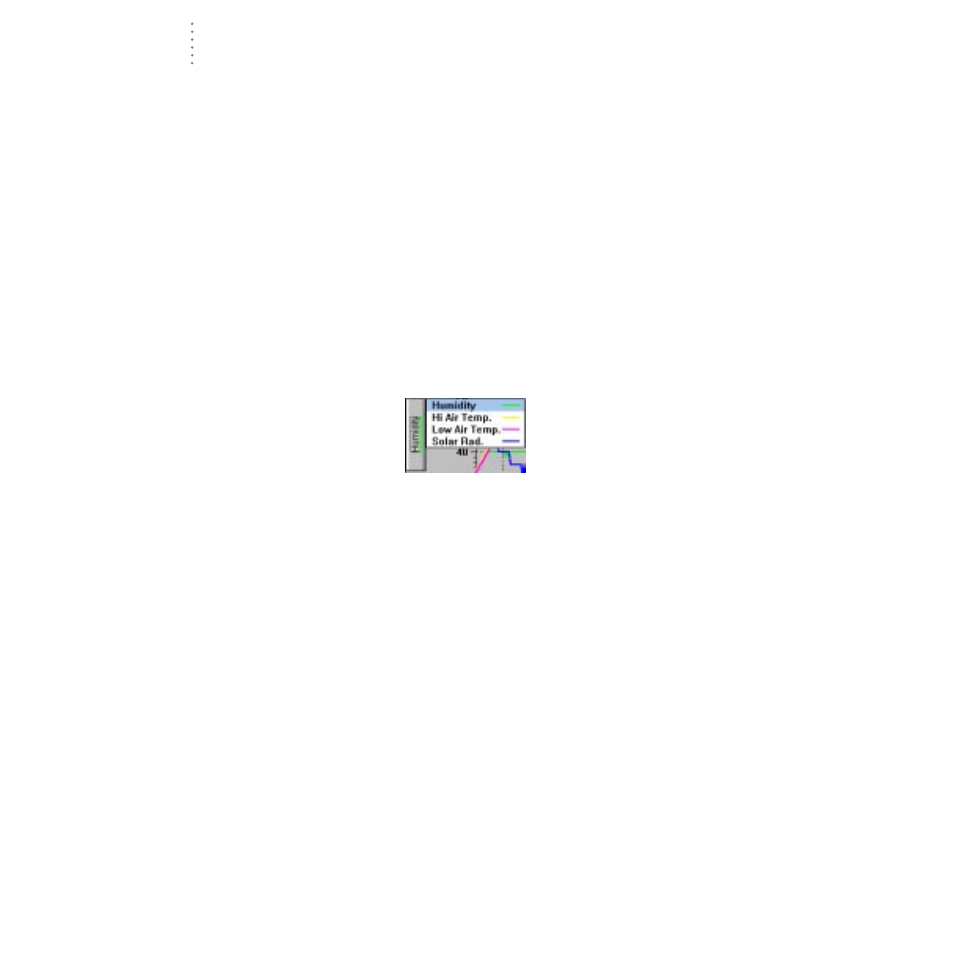
A
XIS
B
UTTON
P
OP
-U
P
M
ENU
▲
Change Plot Span
Choose the desired plot span from the Span menu.
▲
View Historical Data
You may use the scroll bar along the bottom of the strip chart window to view
historical data on the strip charts. Clicking on the scroll arrows moves the
strip chart forward or backward one day at a time. Clicking the scroll bar
moves the strip chart one span at a time. Dragging the scroll box allows you to
quickly find a specific date. As you drag the scroll box, watch the bottom of
the window until the desired date appears, then release the scroll box.
Note:
For plot spans which show less than a full day’s worth of data, clicking on the scroll
arrow and clicking on the scroll bar move the strip chart one plot span at a time.
▲
View Database Information
Double-clicking on any location in the strip chart will open the Browse win-
dow (see “Using the Browse Window” on page 78) to view the raw data for
that time and date.