Specifying performance data collection interval, Preview graph, Performance collection settings – HP XP Application Performance Extender Software User Manual
Page 77

c.
Select the Controller Active check box.
d.
Select the Live check box.
Live performance graphs of the selected workloads for an array are displayed in the Graph
area. To view performance graphs for a different array, select an array from the Array list.
NOTE:
• In the generated graph, a target line indicating the desired SLO value is displayed based
on the SLO types.
• HP recommends that you view only four live graphs at a time. Viewing more than four
live graphs can slow down the refresh rate of the graphs and the response to user oper-
ations.
If you double-click the generated graphs for any workload number (except for workload zero), the
corresponding hosts/PRM groups mapped to that workload number are displayed.
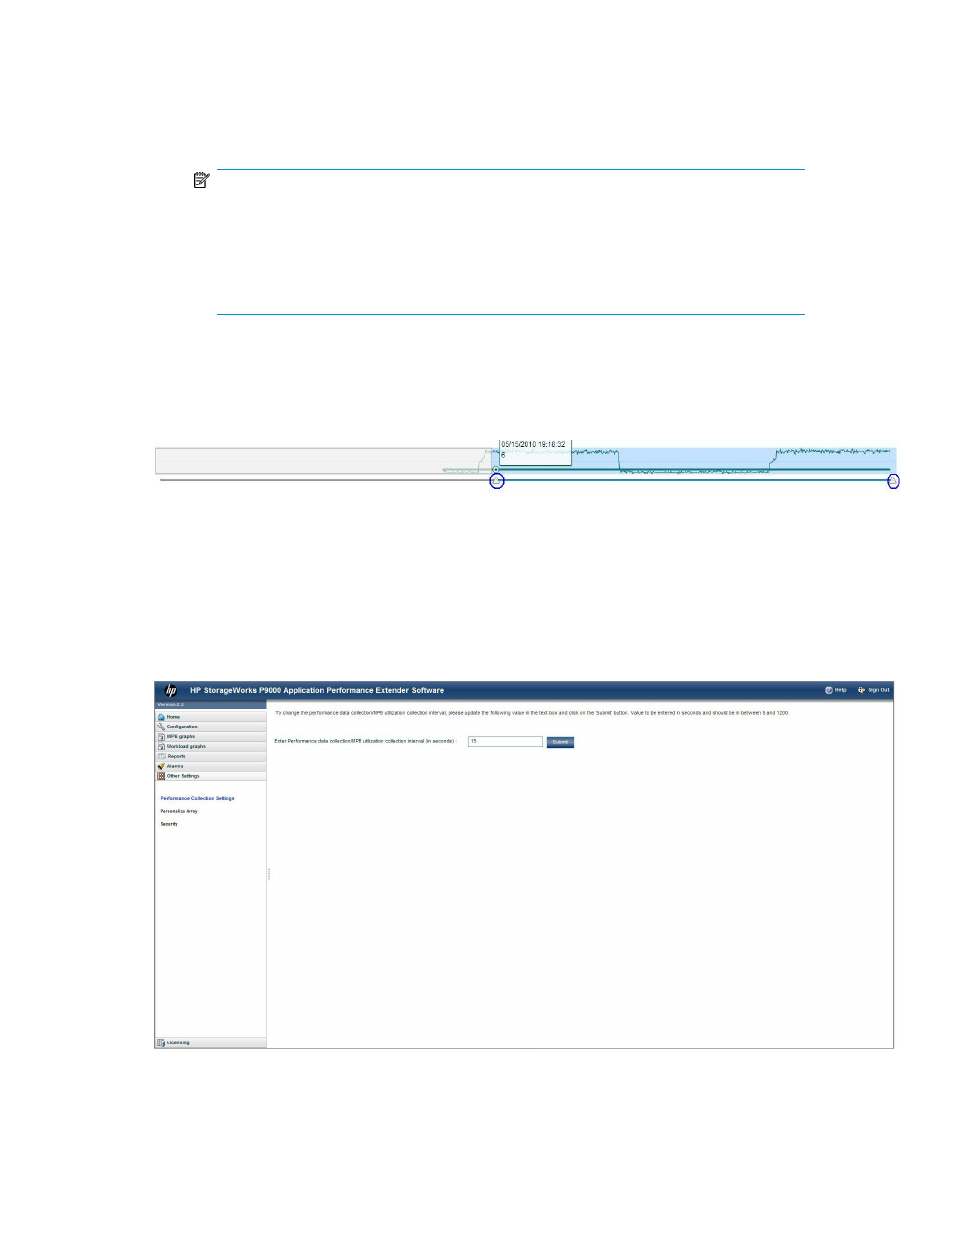
If you want to view only a portion of the graph, use the preview graph area (see
. Adjust
the slider to view specific areas of the graph.
Figure 30 Preview graph
.
Specifying performance data collection interval
The Other Settings screen enables you to set the interval time in seconds for performance data
collection.
shows the performance collection settings screen.
Figure 31 Performance Collection Settings
.
HP StorageWorks P9000 Application Performance Extender Software User Guide
77
