Monitoring workload performance, Workload graphs screen – HP XP Application Performance Extender Software User Manual
Page 75

You can select multiple MP blades.
d.
Click View History.
Historic graphs for the specified period are displayed.
3.
To generate live graphs:
a.
Select an array from the Array list.
b.
Select MP blades
c.
Select the Live check box.
Live utilization graphs of the selected MP blades are displayed.
Monitoring workload performance
This chapter describes how to use P9000 Application Performance Extender to generate and view
performance graphs for the added workloads in your SAN environment.
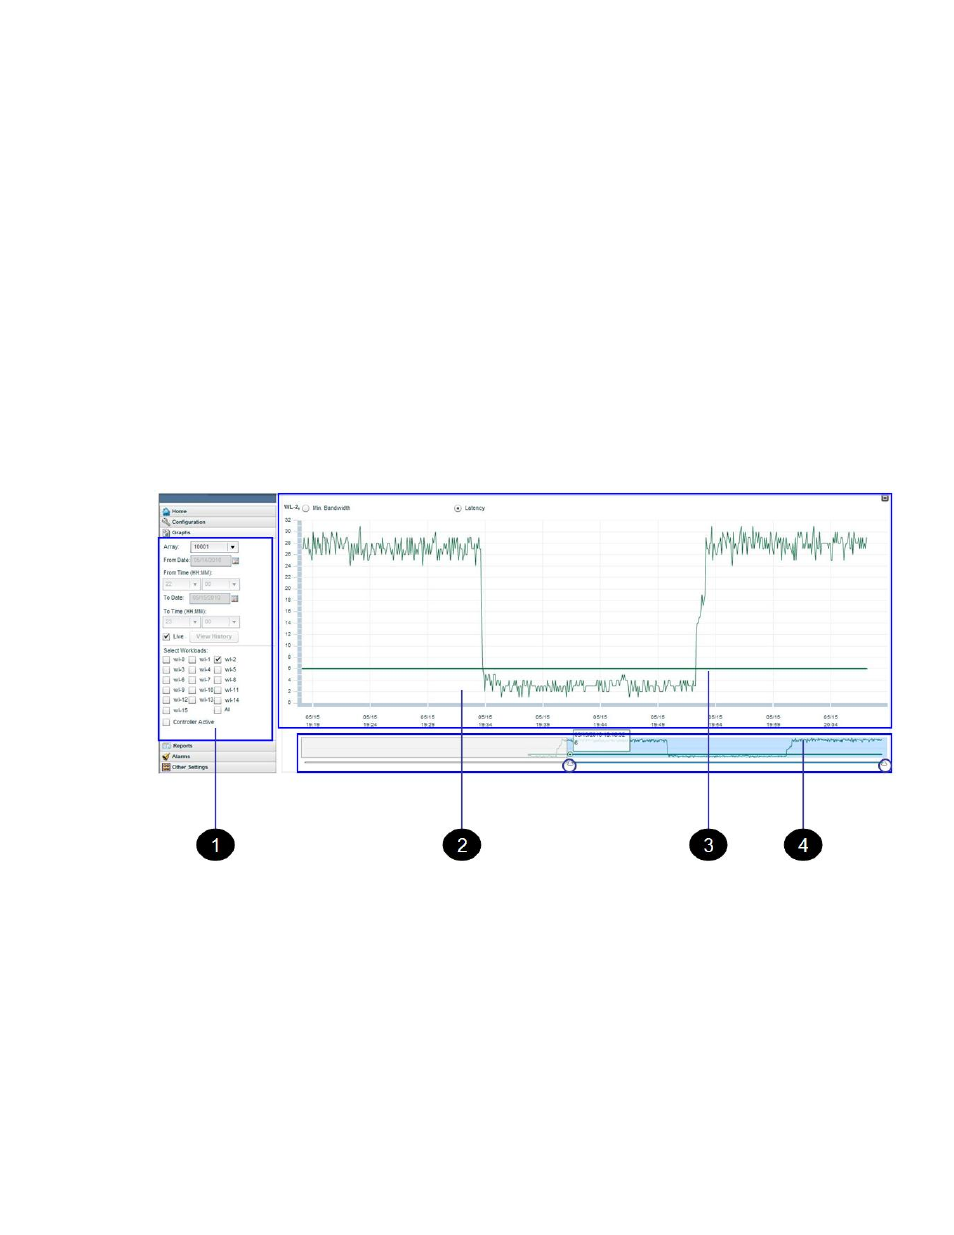
Workload graphs screen
The workload graphs screen is displayed when you select Workload Graphs in the Navigation pane,
as shown in
Figure 29 Workload graphs screen
.
1. Resource selection area
2. Graph area
3. SLO target line
4. Preview graph area
HP StorageWorks P9000 Application Performance Extender Software User Guide
75
