KROHNE Summit 8800 Vol 3 User Manual
Page 48
48
www.krohne.com
08/2013 - MA SUMMIT 8800 Vol3 R02 en
SUMMIT 8800
DISPLAY & WEB ACCESS
06
In the above example, page 1 of 6 is displaying log date called “Stream 2” as a table.
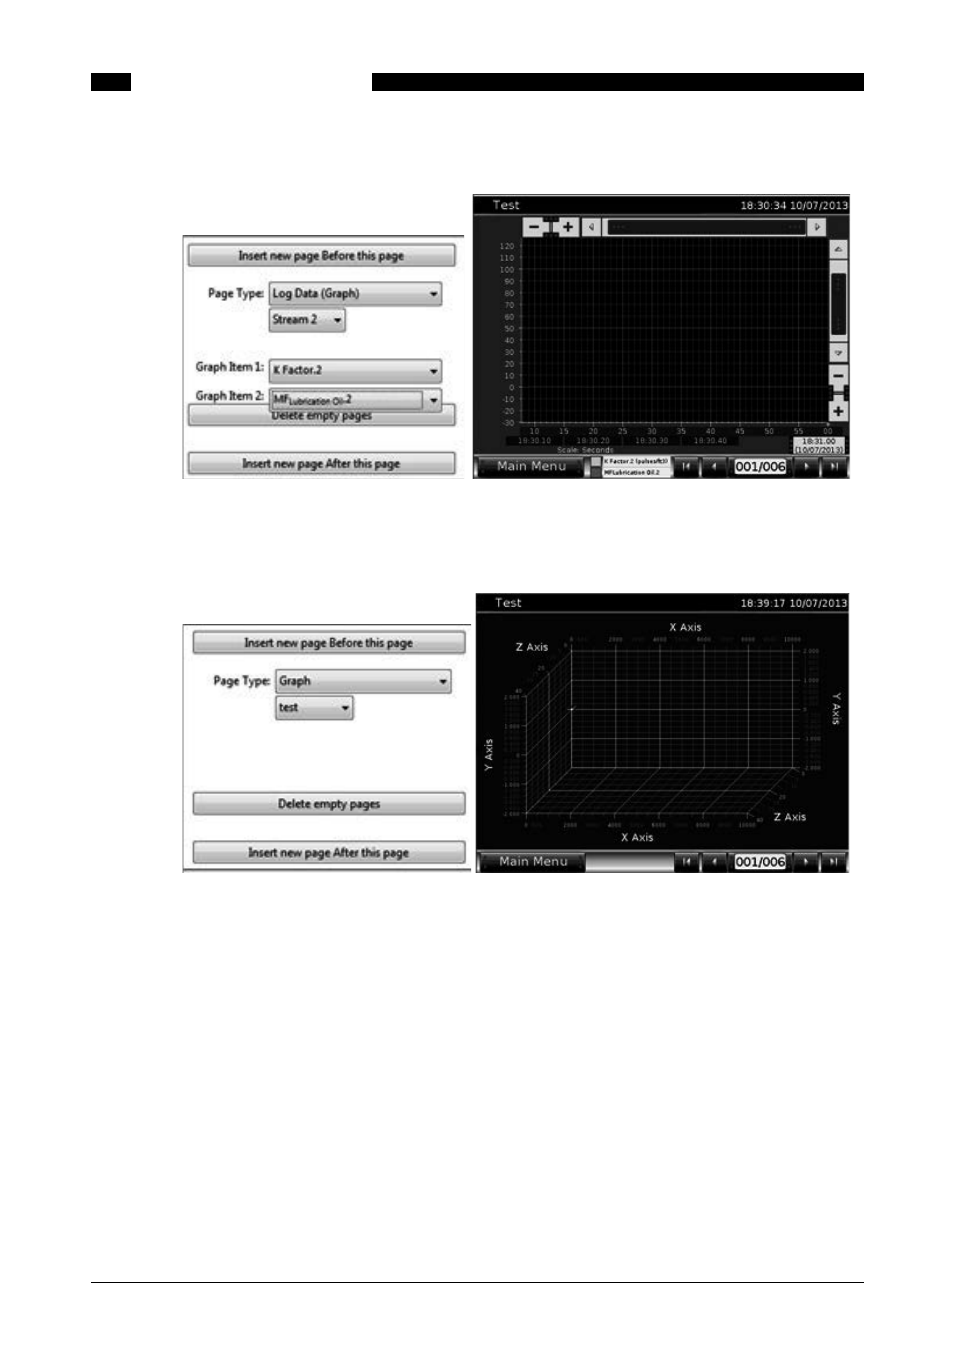
Figure 44 Display page based on log data (Graph)
Here, page 1 of 6 is displaying log data called “Stream 2” and the K- and MF-factor displayed as
a graph.
Figure 45 Display page based on a X-Y-Z graph
In the above example, page 1 of 6 is displaying X-Y-Z graph called “test”.
See also other documents in the category KROHNE Equipment:
- BATCHFLUX 5500 C Quickstart EN (20 pages)
- IFC 050 Converter Quickstart EN (28 pages)
- IFC 100 Converter Quickstart EN (32 pages)
- IFC 300 Converter Quickstart EN (68 pages)
- OPTIFLUX 1000 Quickstart EN (20 pages)
- OPTIFLUX 2000 Quickstart EN (24 pages)
- OPTIFLUX 4000 Quickstart EN (24 pages)
- OPTIFLUX 4040C Quickstart EN (16 pages)
- OPTIFLUX 5000 Flange Quickstart EN (20 pages)
- OPTIFLUX 5000 Sandwich Quickstart EN (20 pages)
- OPTIFLUX 6000 Quickstart EN (28 pages)
- OPTIFLUX 7300 Quickstart EN (24 pages)
- OPTIPROBE Quickstart EN (16 pages)
- TIDALFLUX 2300 F EN (44 pages)
- TIDALFLUX 2300 F Quickstart EN (24 pages)
- WATERFLUX 3000 EN (40 pages)
- WATERFLUX 3000 Quickstart EN (24 pages)
- WATERFLUX 3070 EN (80 pages)
- WATERFLUX 3070 Quickstart EN (32 pages)
- USB ADAPTER PLUS EMF EN (16 pages)
- IFC 050 Converter Modbus EN (20 pages)
- IFC 100 Converter FOUNDATION FIELDBUS EN (64 pages)
- IFC 100 Converter Modbus EN (20 pages)
- IFC 300 Converter FOUNDATION FIELDBUS EN (60 pages)
- IFC 300 Converter HART 0102 EN (20 pages)
- IFC 300 Converter HART 0201 EN (23 pages)
- IFC 300 Converter Modbus EN (24 pages)
- IFC 300 Converter PROFIBUS PA DP EN (40 pages)
- OPTIFLUX 2000-4000 IECEx EN (16 pages)
- OPTIFLUX 2000-4000-5000-6000-7300-IFC 300 Ex EN (40 pages)
- OPTIFLUX 2000-4000-5000-6000 -IFC 100 Ex EN (24 pages)
- OPTIFLUX 4040 C Ex EN (20 pages)
- OPTIFLUX x300 Ex Zone2 EN (1 page)
- H250 M9 ES EN (36 pages)
- VA 40-VA 45 EN (36 pages)
- H250 M10 ATEX II2G Ex d EN (16 pages)
- H250 M10 ATEX II3D Ex t EN (16 pages)
- H250 M40 ATEX II2D Ex t-II2G Ex d EN (20 pages)
- H250 M40 ATEX II2G Ex i EN (20 pages)
- H250 M40 ATEX II3G Ex nA EN (20 pages)
- H250 M40 Ex II2G Reed EN (2 pages)
- H250 M9 ATEX II2G Ex i EN (16 pages)
- H250 M9S ATEX II3D Ex t-II3G Ex nA EN (20 pages)
- M8E Converter HART 0101 EN (13 pages)
- DK 32-DK 34 ATEX II2G Ex i EN (16 pages)