Real-time statistics graph areas – Teledyne LeCroy PETracer ML Analyzer and Exerciser User Manual User Manual
Page 201
PETracer ML User Manual
Chapter 9: Reports and Tools
Teledyne LeCroy
193
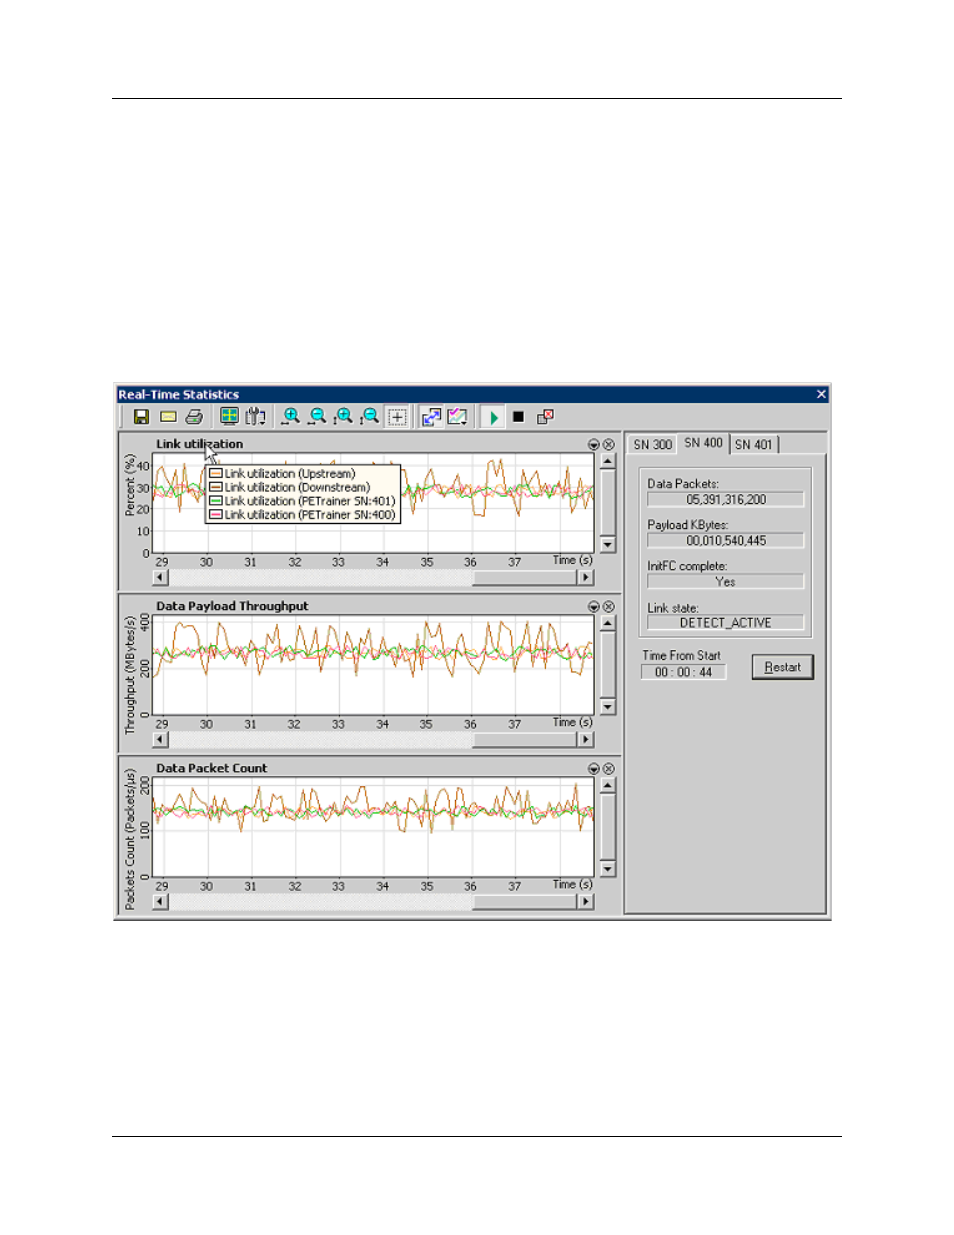
Real-Time Statistics Graph Areas
The Real-time Statistics window has three graph areas:
•
Link Utilization
•
Data Payload Throughput
•
Data Packet Count
Each graph area has Upstream and Downstream graphs for a PETracer device (if
connected to a host machine), plus as many graphs as PETrainer™ devices connected
to the host machine.
The Statistics Accumulation area shows the PETracer statistics tab, plus as many tabs
as PETrainer devices connected:
See also other documents in the category Teledyne LeCroy Equipment:
- 6Zi Rackmount (12 pages)
- HDO Oscilloscope Rackmount (14 pages)
- LSIB-1 Host Interfaces (44 pages)
- OC1021 Oscilloscope Cart (9 pages)
- OC1024 Oscilloscope Cart (10 pages)
- OC910 Oscilloscope Cart (2 pages)
- TTL-AUX-OUT (1 page)
- WaveJet Rackmount (1 page)
- Zi Oscilloscope Rackmount (12 pages)
- USB2-GPIB (12 pages)
- WM8Zi-2X80GS (2 pages)
- WR6ZI-8CH-SYNCH (6 pages)
- Zi Oscilloscope Synchronization ProBus Module (Zi-8CH-SYNCH) (16 pages)
- LogicStudio (42 pages)
- WaveSurfer MXs-B Getting Started Manual (126 pages)
- WaveSurfer MXs-B Quick Reference Guide (16 pages)
- X-STREAM OSCILLOSCOPES Remote Control (305 pages)
- WS-GPIB (12 pages)
- PXA125 (219 pages)
- PXD Series (42 pages)
- PXD222 (38 pages)
- Oscilloscope System Recovery (8 pages)
- LabMaster 9Zi-A (264 pages)
- LabMaster 10Zi Rackmount (8 pages)
- LabMaster 10Zi Getting Started Manual (236 pages)
- LabMaster 10Zi Operators Manual (198 pages)
- WaveAce 1000_2000 (108 pages)
- WaveAce 1000_2000 Remote Control (92 pages)
- WaveRunner Xi-A Quick Reference Guide (16 pages)
- WaveRunner XI SERIES Operator’s Manual (233 pages)
- WaveMaster Automation Command (667 pages)
- WaveMaster 8 Zi_Zi-A (190 pages)
- WaveMaster 8000A (46 pages)
- WavePro 7 Zi_Zi-A (188 pages)
- WaveExpert series Automation Manual (285 pages)
- WaveExpert 9000_NRO9000_SDA100G Getting Started Manual (50 pages)
- WaveExpert 100H Operators Manual (348 pages)
- WaveRunner Automation Command (460 pages)
- WaveRunner Xi-A Getting Started Manual (128 pages)
- WaveRunner 6 Zi and 12-Bit HRO Getting Started Manual (198 pages)
- WaveRunner 6 Zi Quick Reference Guide (20 pages)
- WaveRunner 6 Zi-ExtRef-IN_OUT (2 pages)
- WaveSurfer Automation Command (226 pages)
- HDO 4000 Getting Started Guide (48 pages)
- HDO Removable Hard Drive (2 pages)