IAI America RCA2-TW4N User Manual
Page 103
95
12. Life
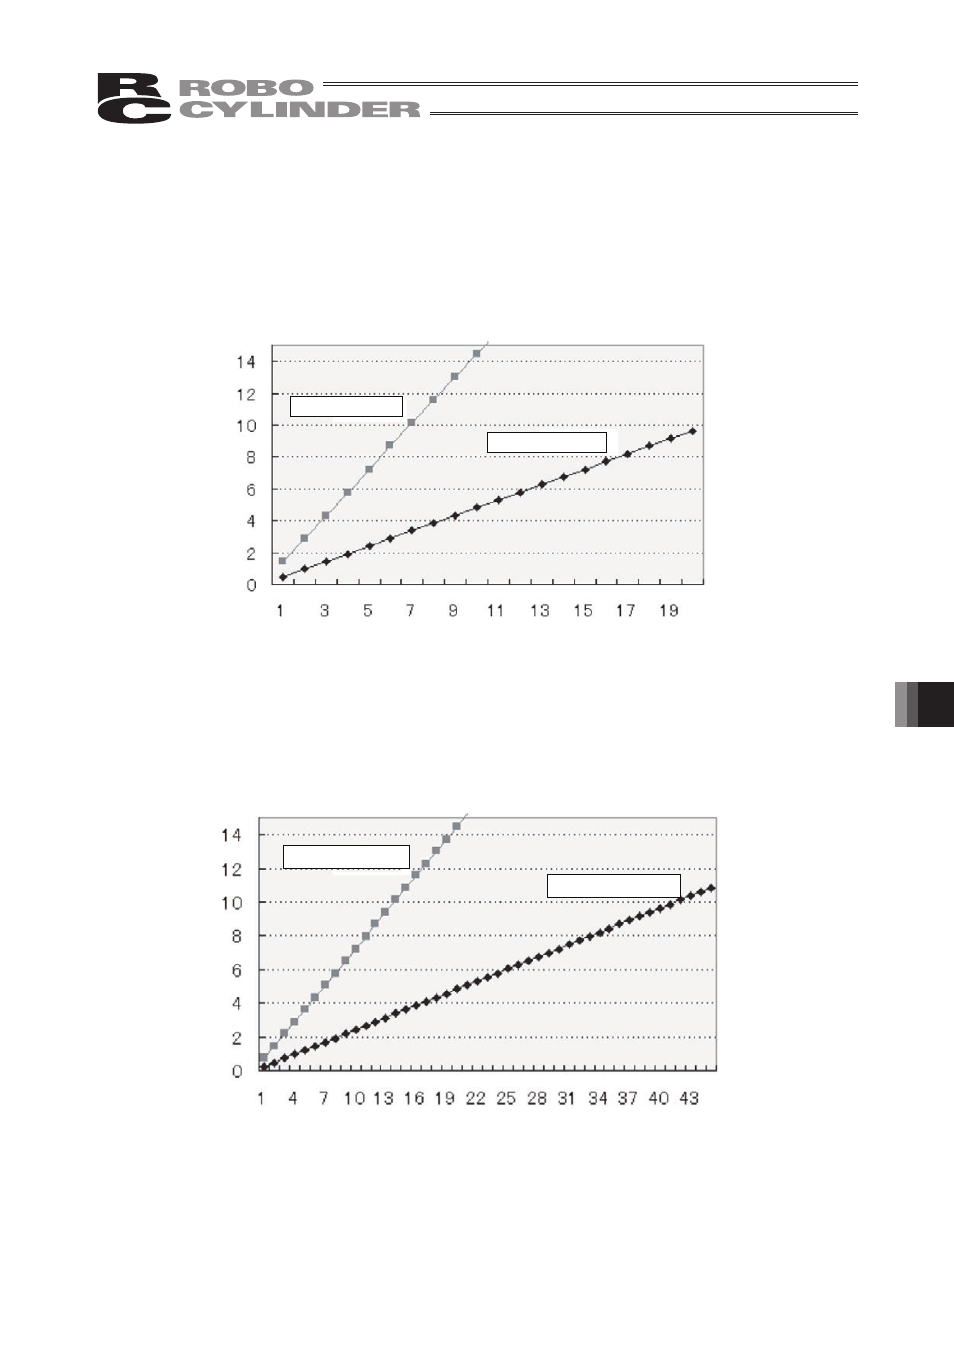
(2) Vertical application
The graph below shows the relationship between the cycle time for one back-and-forth operation and the
life of the product in a vertical application (product life: 5 million back-and-forth operations).
The lines based on 8 hours of operation and 24 hours operations a day, for 240 days a year, are shown.
Use this graph as a reference when determining the product life.
Life (years)
8 hours of operation
24 hours of operation
Cycle time (sec)
12.2.1
Relationship of Cycle Time and Product Life
(1) Horizontal application
The graph below shows the relationship between the cycle time for one back-and-forth operation and the
life of the product in a horizontal application (product life: 10 million back-and-forth operations).
The lines based on 8 hours of operation and 24 hours operations a day, for 240 days a year, are shown.
Use this graph as a reference when determining the product life.
Life (years)
8 hours of operation
24 hours of operation
Cycle time (sec)