Viewing the bar graph display, Viewing the bar graph display 101 – HP OMNIBER 718 HP 37718A User Manual
Page 111
101
Storing, Logging and Printing
Viewing the Bar Graph Display
Viewing the Bar Graph Display
Description
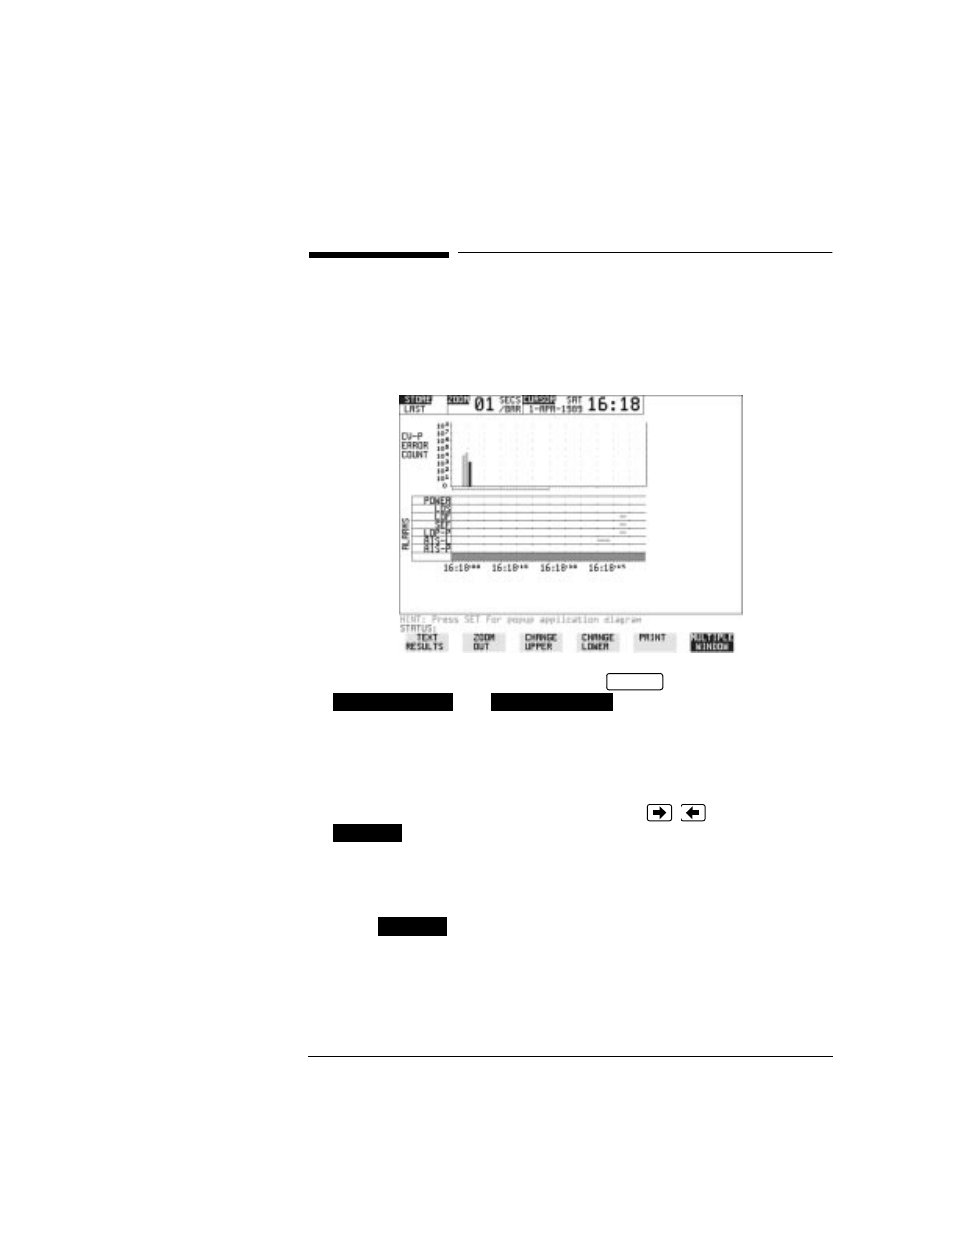
All the graphic results obtained during the measurement are available
for viewing. Identify a period of interest and zoom in for more detailed
examination.
HOW TO:
1
To view the current bar graphs, press
and use
and
to obtain the bar graphs
required.
2
To view previously stored graphs, see "Recalling Stored Graph
Results " page 99.
3
For more detailed inspection of the bar graph, position the cursor
centrally within the area of interest using
,
and select
to reduce the time axis to 15 MINS/BAR. This is only
possible if the graphics results were stored with a STORAGE
resolution of 1 SEC,1 MINS or 15 MINS.
For further reduction of the time axis to 01 MINS/BAR or 01 SECS/
BAR, position the cursor centrally within the area of interest and
select
until the required time axis is obtained.
The top row of the display comprises three fields:
Store
Memory location in which the displayed bar graph data
is stored. Store can only be changed when the status of
stored results is displayed. See "Recalling Stored
Graph Results " page 99.
GRAPH
CHANGE UPPER
CHANGE LOWER
ZOOM IN
ZOOM IN