Diadem view: viewing, measuring & editing data, Dia dem view: viewing, measuring & editing data – Measurement Computing WavePort rev.3.0 User Manual
Page 101
DIAdem®
04-19-00
DIAdem VIEW: Viewing, Measuring & Editing Data 7-27
DIAdem VIEW: Viewing, Measuring & Editing Data
DIAdem
®
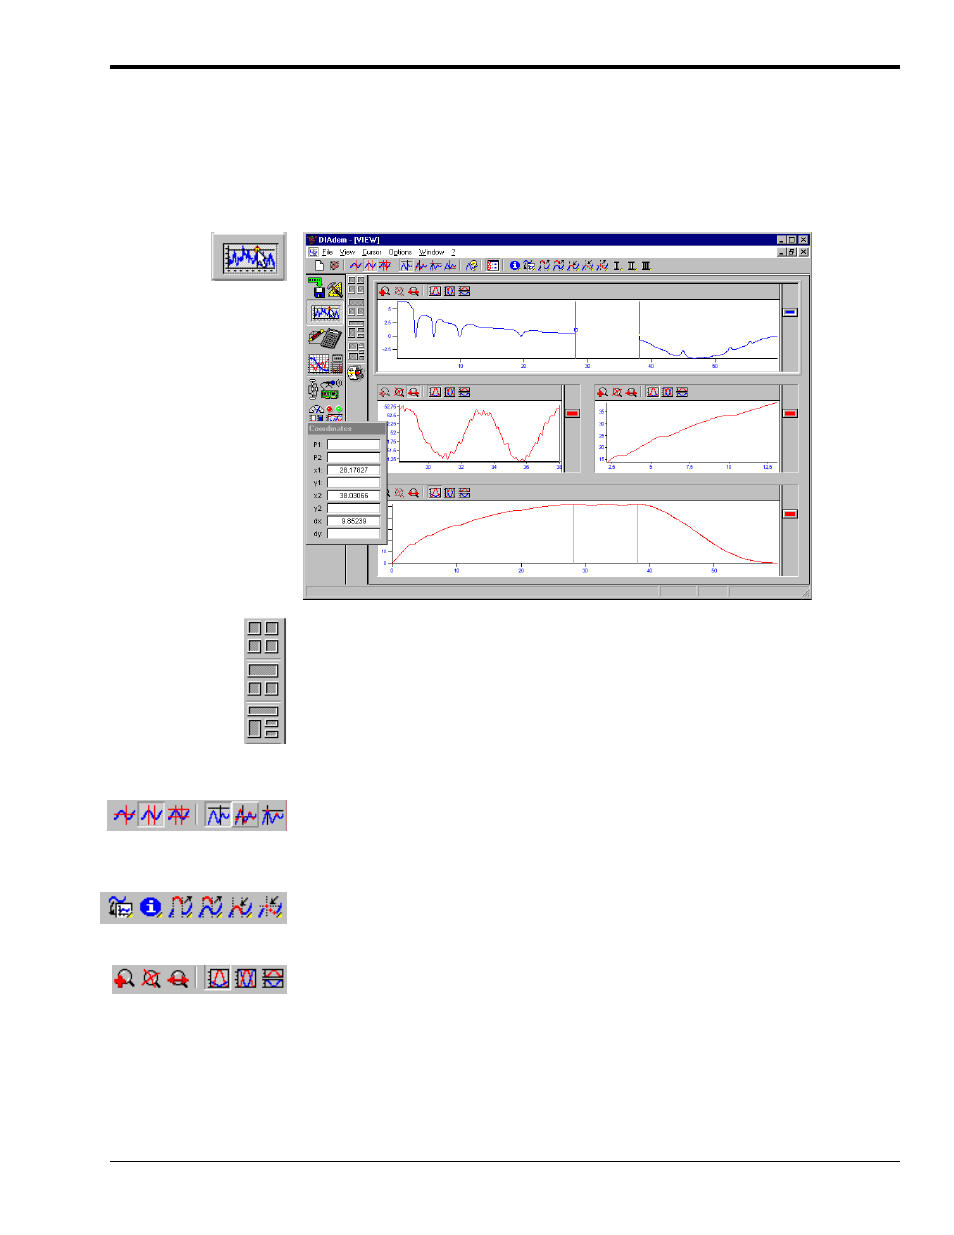
VIEW allows you to view, measure and edit your data. Data may be displayed as
graphs defined by an X and Y channel of the data area in various axis systems. Various cursors
are used for inspecting the graphs, using which you can zoom, scroll or carry out
measurements.
DIAdem
®
VIEW
DIAdem
®
VIEW Module bar
The DIAdem
®
VIEW Module bar determines the way in which the screen is divided up. You
will find various possibilities for standard and customized screen partitions in the
corresponding Action bars.
After double-clicking on an axis system, you can coordinate the data channels to be displayed,
thereby defining the graphs. A legend can be displayed beside each axis system showing the
data channel name, the unit, the cursor coordinates and any expressions at will. Use the graph
symbol between the axis system and the legend to copy a graph into another axis system by
grabbing it with the mouse and moving it into the target axis (drag and drop).
Part of the DIAdem
®
VIEW Tool bar
In the Tool bar you will find various types of graphics cursors used to inspect graphs, as well as
various measurement cursors with which you can find characteristic graph points. Other useful
features are the symbol for turning the coordinate display off and on and the feature Delete all
graphs.
Command icons
assigned Autosequences
In addition to the standard functions, other functions can be assigned to the command icons,
which are marked with a yellow triangle, as Autosequences (requires the Autosequence option).
Axis-specific Tool bar
Each DIAdem
®
VIEW axis system has its own axis-specific Tool bar which you can use to
enlarge a selected region of the graph (zoom and scroll) and, in the case of several axes with
different value ranges, change the scaling of the Y-axis.