Measurement Computing WavePort 312P rev.1.0 User Manual
Page 71
PowerVista/312 User’s Manual
Event Capture 9-3
• THD Trigger: is an event trigger that is compared against the voltage and current THD in percent as
appropriate. If the trigger value is exceeded, event capture will only be initiated if the RMS voltage is
above the RMS Min Trigger. Thus, loss of signal that generates an excessive THD because there is no
fundamental voltage will not trigger events. Note also that this trigger is presently only available for
power systems with Base Frequency less than 75 Hz. For Base Frequencies above 75 Hz, only RMS
quantities are calculated every cycle so THD cannot be determined. This was done so that Event
Capture was possible for 400 Hz systems which necessitate greater computational throughput.
• Zero Cross Trigger: is an event trigger that counts the number of zero crosses that occur within a
voltage signal. If that number of zero crosses exceeds three while the total RMS voltage is greater than
the RMS Min Trigger, then an event is triggered. Loss of voltage that generates multiple zero crosses
per cycle due to noise, will not trigger excessive events.
• Max Events: is the maximum number of events that will be captured in any single event capture
session. This is not the shot limit on the database, which is virtually unlimited.
• Post Trig Cycles: is the minimum number of post trig cycles that will be captured when an event is
triggered. If the triggering continues from cycle to cycle during and after the Post Trig Cycles, then the
event will continue to accumulate cycles until triggering stops.
• Monitor Only, No Capture to Disk: is a mode of event capture where no events are logged to disk,
but all other features are operating. If checked, monitor only mode is activated. This allows the user to
monitor for a brief period to determine if trigger settings are appropriate or set incorrectly. While
monitoring, if a trigger is occurring continuously (due to a bad trigger value), then the Trigger Table will
display a † character in the column and row for the appropriate trigger and input.
• Recording Active: is checked to activate Demand Logging.
• Demand Interval: is specified in hours : minutes : seconds, and defines the interval over which demand
information is captured. Over the interval, every cycle is processed and used to determine the
maximum, minimum and average value over the interval. No cycle will be missed (unless there are
FIFO overruns). If the demand interval is set to say 15 minutes, then the maximum, minimum and
average demand will be recorded on a 15 minute demand interval.
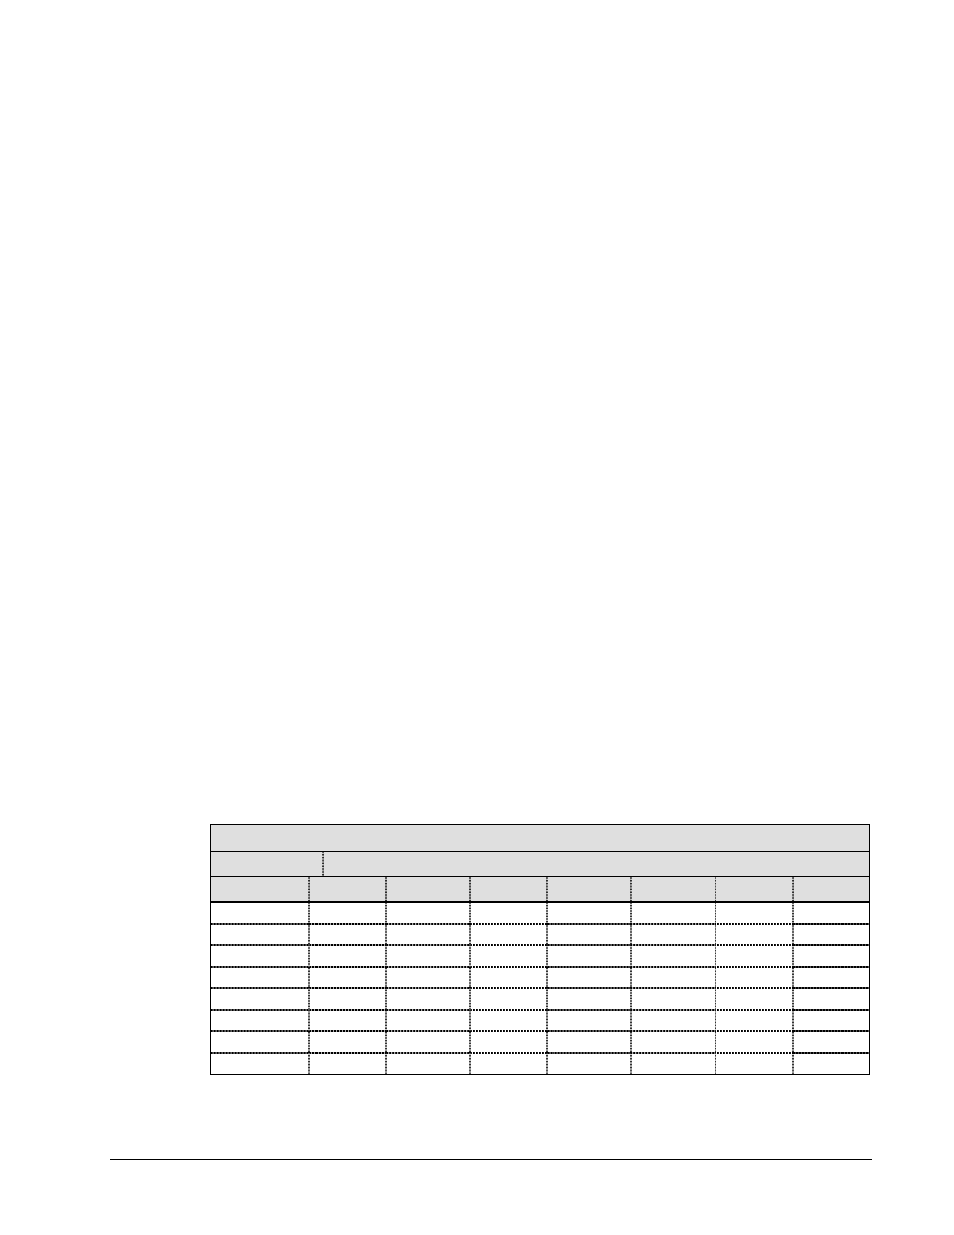
• Demand Window: is the size of the demand log to be captured, up to 28800 points. When the end of
this window is reached, EasyPower Measure will automatically scroll the window so that the last
window size of data is recorded. This allows users to specify a reasonable length of data for capture,
and to always have for example, the last weeks worth of information. Several Demand Window sizes
and Demand Intervals are listed below in Table 10 for reference.
Table 10. Total Window Time for Several Demand Intervals and Window Sizes.
Demand
Demand Window Size in Points
Interval
3600
5760
8640
11520
17280
23040
28800
1 second
1 hr
1.6 hrs
2.4 hrs
3.2 hrs
4.8 hrs
6.4 hrs
8 hrs
10 second
10 hrs
16 hrs
24 hrs
32 hrs
48 hrs
64 hrs
80 hrs
15 second
15 hrs
24 hrs
36 hrs
48 hrs
3 days
4 days
5 days
30 second
30 hrs
48 hrs
72 hrs
4 days
6 days
8 days
10 days
1 minute
60 hrs
4 days
6 days
8 days
12 days
16 days
20 days
5 minute
12.5 days
20 days
30 days
40 days
60 days
80 days
100 days
10 minute
25 days
40 days
60 days
80 days
120 days
160 days
200 days
15 minute
37.5 days
60 days
90 days
120 days
180 days
240 days
300 days