Input level meter, 12 input level meter – Measurement Computing WavePort 312P rev.1.0 User Manual
Page 33
PowerVista/312 User’s Manual
Software Framework 3-17
• Autoscale: Via the Plot Context Menu, Autoscale toggles on and off the autoscaling feature of the window. It is
recommended that Autoscale be left on so that when a curve is plotted, there is no confusion about the existence of
data. At times when disabled, a shot can be selected, and no data appear because the plot Y axis scales are set
outside the data range.
• Scroll Bars: Via the Plot Context Menu, Scroll Bars toggles on and off the horizontal and vertical scroll bars.
These scroll bars can be used to perform quick panning and zooming of the wave data being displayed. Note that
the arrow buttons at each end of the bar have zoom in and out capability instead of single step scrolling of the plot.
This is one of the few features in EasyPower Measure that does not follow standard windows convention.
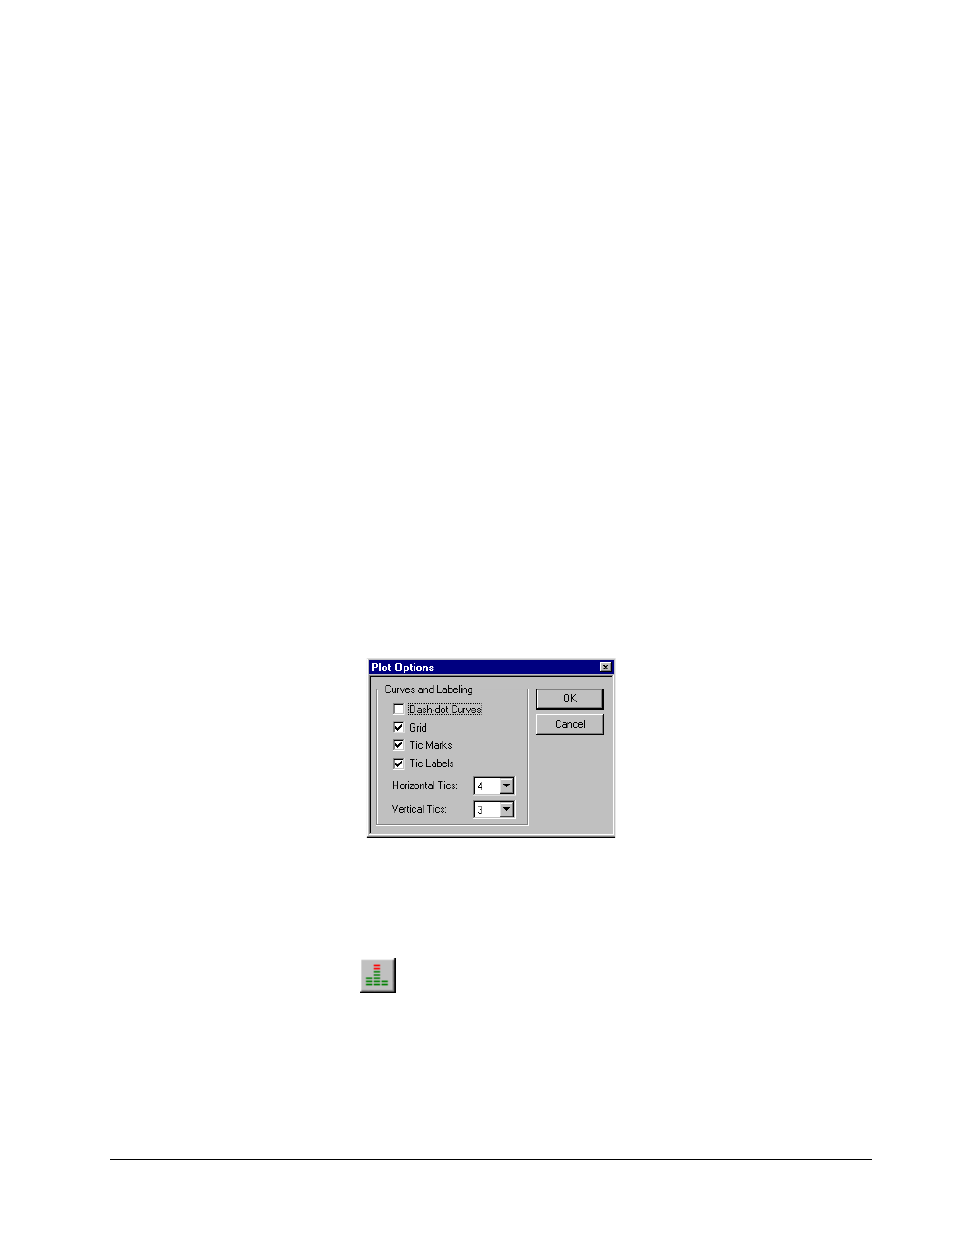
• Plot Options: Via the Plot Context Menu, Plot Options
(see Figure 3-8)
are used to customize the plot for data
viewing and plotting. Access the plot context menu with a right mouse click in the plot area and then select Plot
Options. The customizing options include:
⇒ Dash-Dot Curves: When a plot is printed, this feature causes the plotted curves to be dashed or dotted
depending upon the curve so that black and white plot labeling is understandable. This should be disabled for
color plots, as it is unnecessary.
⇒ Grid: This turns the red grid on and off.
⇒ Tic Marks: This turns plot tic marks next to the horizontal and vertical axis on and off.
⇒ Tic Labels: This turns plot tic labels on and off. If off, only maximum and minimum labels for each axis are
displayed. Note that for display efficiency during data capture and also physical space, X axis labeling on
screen only includes the minimum and maximum values. When plots are copied to the clipboard or printed,
they will include the additional labels at every tic.
⇒ Horizontal Tics: This allows the user to specify the number of horizontal tics (vertical grid lines) used on the
plot. This also affects the number of labels displayed with the tics.
⇒ Vertical Tics: This allows the user to specify the number of vertical tics (horizontal grid lines) used on the
plot. This also affects the number of labels displayed with the tics.
Figure 3-8. Plot Options Dialog.
• Configuration: Via the Plot Context Menu, the user also has access to the same pull down menu under the
Configuration menu item in the Main Menu. This is supplied as a matter of convenience and offers another
method to access configuration dialogs.
3.12 Input Level Meter
The input level meter has been include with EasyPower Measure so that an immediate indication of input signal
peaks vs. input range can be seen. The software has been designed to make full use of the hardware
programmable gain amplifiers, which allow us to maximize data accuracy. The Input Level Meter is most
effective when setting up the instrument, and while running the Phasor Diagram. The continuous update nature
of the Phasor Diagram causes the Input Level Meter to also update at the same rate of display.