Measurement Computing WavePort 312P rev.1.0 User Manual
Page 56
6-2 Detailed Harmonics
PowerVista/312 User’s Manual
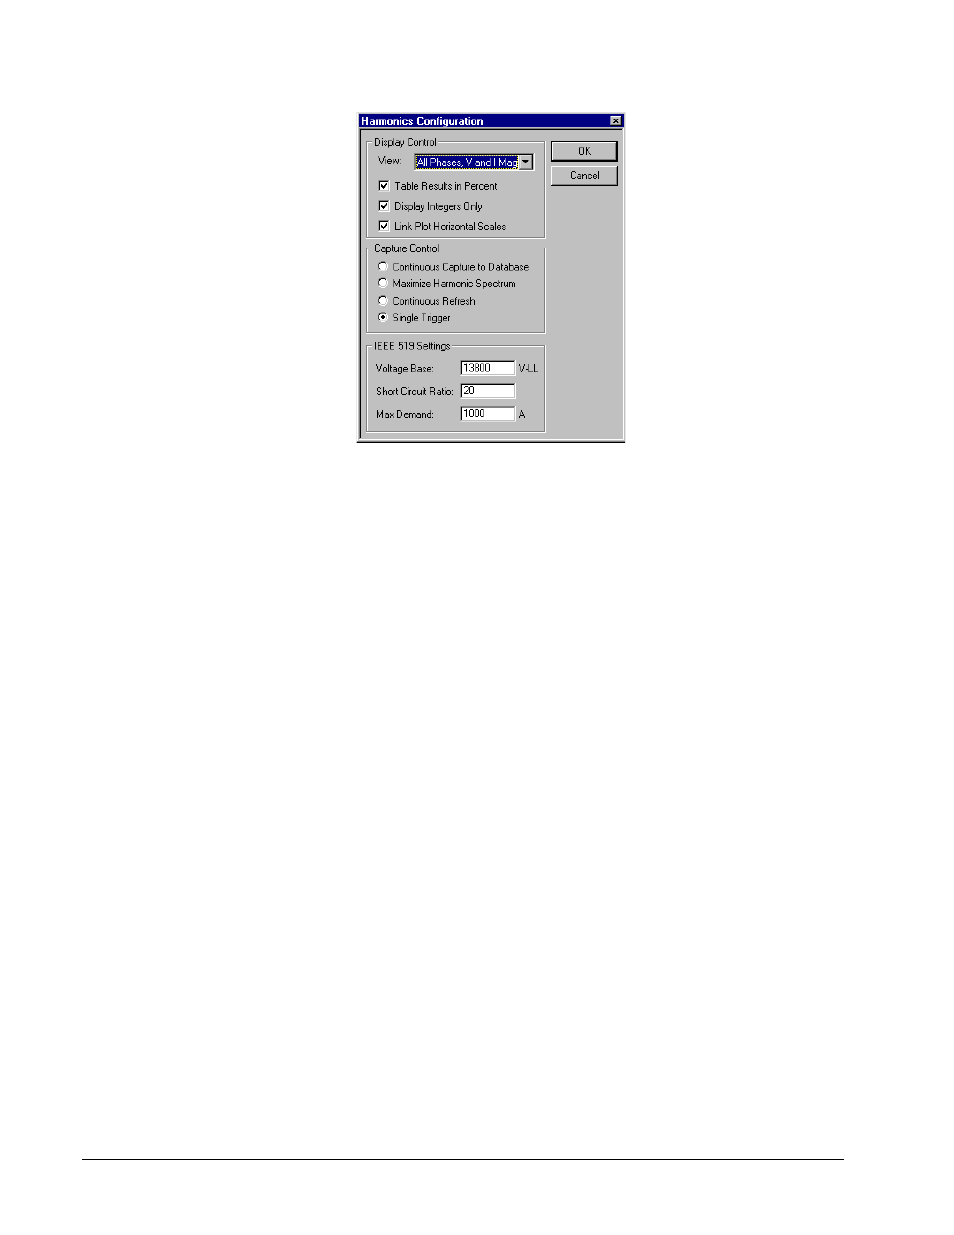
Figure 6-1. Detailed Harmonics Configuration Dialog.
Items in the Detailed Harmonics Configuration include:
• View: is a drop down list of all Detailed Harmonic view possibilities. Each item in the list is self explanatory and
allows the user to view all collected data.
• Table Results in Percent: gives the user the option to view harmonic results in percent. This affects both plots
and tabulations. If checked, results are displayed in percent. If unchecked, results are displayed in Volts and
Amps. This can also be toggled from the Engineering vs. Percent Toggle toolbar button.
• Display Integers Only: gives the user the ability to display integer harmonic results only. When checked
tabulations only show integers and plots change from line plots to bar charts.
• Link Plot Horizontal Scales: when checked will link the top and bottom plots (Harm Wave1 to Harm Wave2
and Harm Spec1 to Harm Spec2) so that when any panning or zooming is performed, the alternate partner plot will
follow the scaling. This is a horizontal axis link only.
• Capture Control: allows the user to select from four modes of capturing data. These are:
⇒ Continuous Capture to Database: In this mode, as quick as a capture is processed and displayed, it will be
snapped in the database and another capture will begin. This process is repeated indefinitely until the hard
disk is filled or the user terminates the session. As each capture is automatically archived, an additional text
descriptor "- Auto X" is appended to the end of the shot description. X will begin at 1 at the start of the
session and will automatically increment by one until the end of the session. Thus, an auto snap sequence is
clearly recognized.
⇒ Maximize Harmonic Spectrum: In this mode, as quick as a capture is processed and used to generate a
maximum spectra for each signal, another capture will begin. This method of data capture is used to
determine a maximum harmonic spectrum over the capture period. This is most useful when monitoring arc
furnaces and any quickly changing load where it is difficult to determine spectral content. This mode
generates a worst case spectrum which can be used in design to guarantee conservative specifications.