Chapter 8 - cycle-by-cycle capture, 1 cycle-by-cycle overview, 2 cycle-by-cycle configuration – Measurement Computing WavePort 312P rev.1.0 User Manual
Page 65: 8 cycle-by-cycle capture
PowerVista/312 User’s Manual
Cycle-by-Cycle Capture 8-1
8 Cycle-by-Cycle Capture
8.1 Cycle-by-Cycle Overview
Cycle-by-Cycle Capture utilizes the same calculation engine used in the Phasor Diagram. Instead of updating
the screen with a single cycle value, each cycle of RMS demand information is saved in a user specified capture
window. Thus, cycle-by-cycle detailed trending of all RMS demand quantities can be captured and plotted.
Results from this feature can be used to evaluate flicker, motor starts, dynamic response of power systems and
associated equipment, and ride system power profiles.
Data analysis includes:
• RMS volts, amps, watts, vars.
• Frequency (if frequency following is enabled).
• Definable capture window size in cycles to 28800 cycles (8 minutes at 60 Hz).
• Automatic snapshot to data base on a full window (not one cycle missed).
• Continuous update of results displayed while measuring.
8.2 Cycle-by-Cycle Configuration
The Cycle-by-Cycle configuration gives the user access to several display and capture features. All critical
information for defining Cycle-by-Cycle capture is accessed here.
Items in the Critical Configuration:
• None
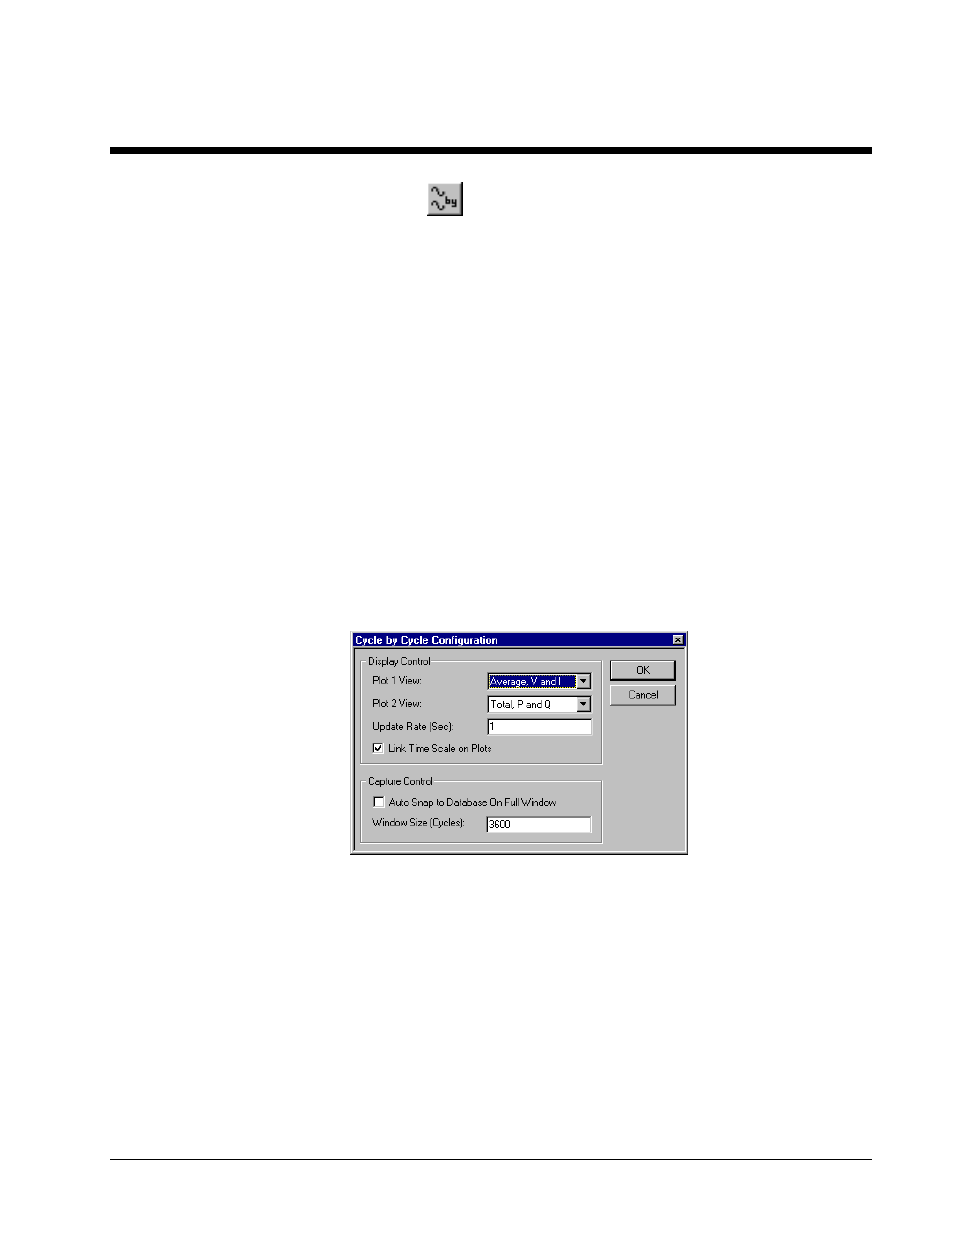
Figure 8-1. Cycle-by-Cycle Configuration Dialog.
Items in the Cycle-by-Cycle Configuration include:
• Plot 1 View: is a drop down list of all Cycle-by-Cycle view possibilities for Plot 1. Each item in the
list is self explanatory and allows the user to view all collected data via Plot 1 and Plot 2 choices.
• Plot 2 View: is a drop down list of all Cycle-by-Cycle view possibilities for Plot 2. Each item in the
list is self explanatory and allows the user to view all collected data via Plot 1 and Plot 2 choices.