Graphical result window features, 11 graphical result window features – Measurement Computing WavePort 312P rev.1.0 User Manual
Page 32
3-16 Software Framework
PowerVista/312 User’s Manual
3.11 Graphical Result Window Features
Graphical results presented in the graphical Result Windows all have a set of common features to enhance both data
capture as well as review. All of the graphical windows behave the same with exception to the Phasor Graphics window
when in the phasor diagram mode. When in waveshape plotting mode, the standard features are again enabled. Several
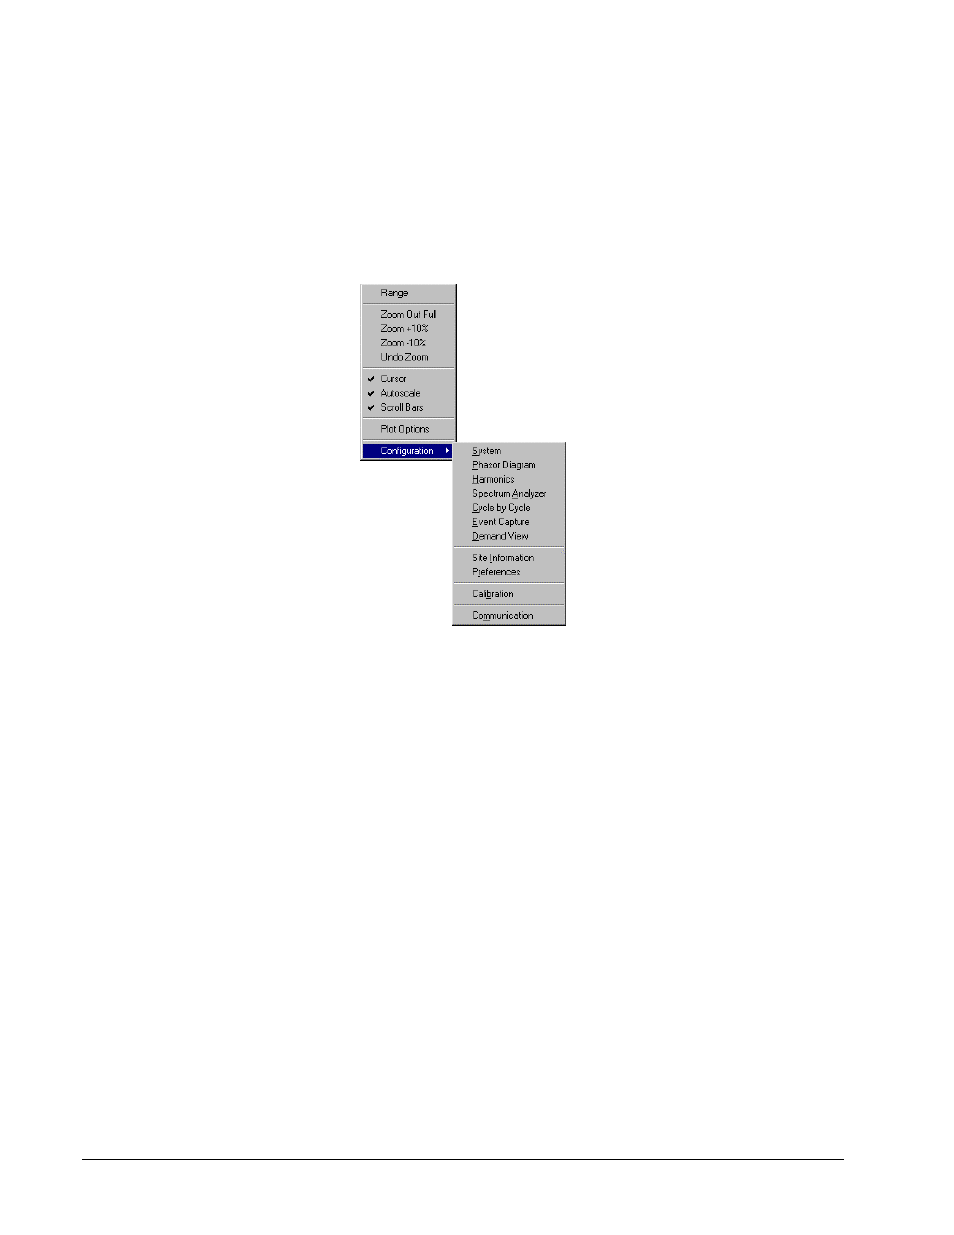
graphical features are accessed with a right mouse button click, which displays a Plot Context Menu
(see Figure 3-7)
with
the graphical features listed ready for use.
Figure 3-7. Plot Context Menu, accessed via right mouse click.
Zoom feature and Plot Context Menu features include:
• Click and Drag Zoom: Simply by left mouse clicking and dragging the mouse across the graphical area of a plot
window, zooming is accomplished. While dragging, a rectangular rubber-band is displayed to alert the user of the
area being zoomed in on. To undo or return to the overall view, right mouse click, and select Undo Zoom or
Zoom Out Full respectively.
• Range: Via the Plot Context Menu, Range allows the user to enter desired X and Y axis scales. Note that
entering values will have no effect if the Autoscale feature is enabled. To use this feature effectively, disable the
Autoscale feature in the Plot Context Menu.
• Zoom Out Full: Via the Plot Context Menu, Zoom Out Full allows the user to quickly recover from any series of
click drag and zooms. When in Autoscale mode, the plot is zoomed out so that the entire range of data is visible.
• Zoom +10%: Via the Plot Context Menu, Zoom +10% zooms in both X and Y axes by 10%.
• Zoom -10%: Via the Plot Context Menu, Zoom -10% zooms out both X and Y axes by 10%.
• Undo Zoom: Via the Plot Context Menu, Undo Zoom takes the user to the previous graphic zoom or out full
condition. There are 10 levels of zoom undo.
• Cursor: Via the Plot Context Menu, Cursor toggles on and off the digital data cursor at the bottom of the
window. This cursor does not display interpolated X and Y values according to scales and mouse position in the
window, but displays the actual digital values of data being plotted. For this reason, plots that have a large number
of points may have to be zoomed in a little first before a true data reading can be seen due to the pixel resolution
of the computer screen.