Results tab – EXFO FTB -5240S/5240BP Optical Spectrum Analyzer User Manual
Page 303
Managing Results
OSA
297
Managing Spectral Transmittance Test Results
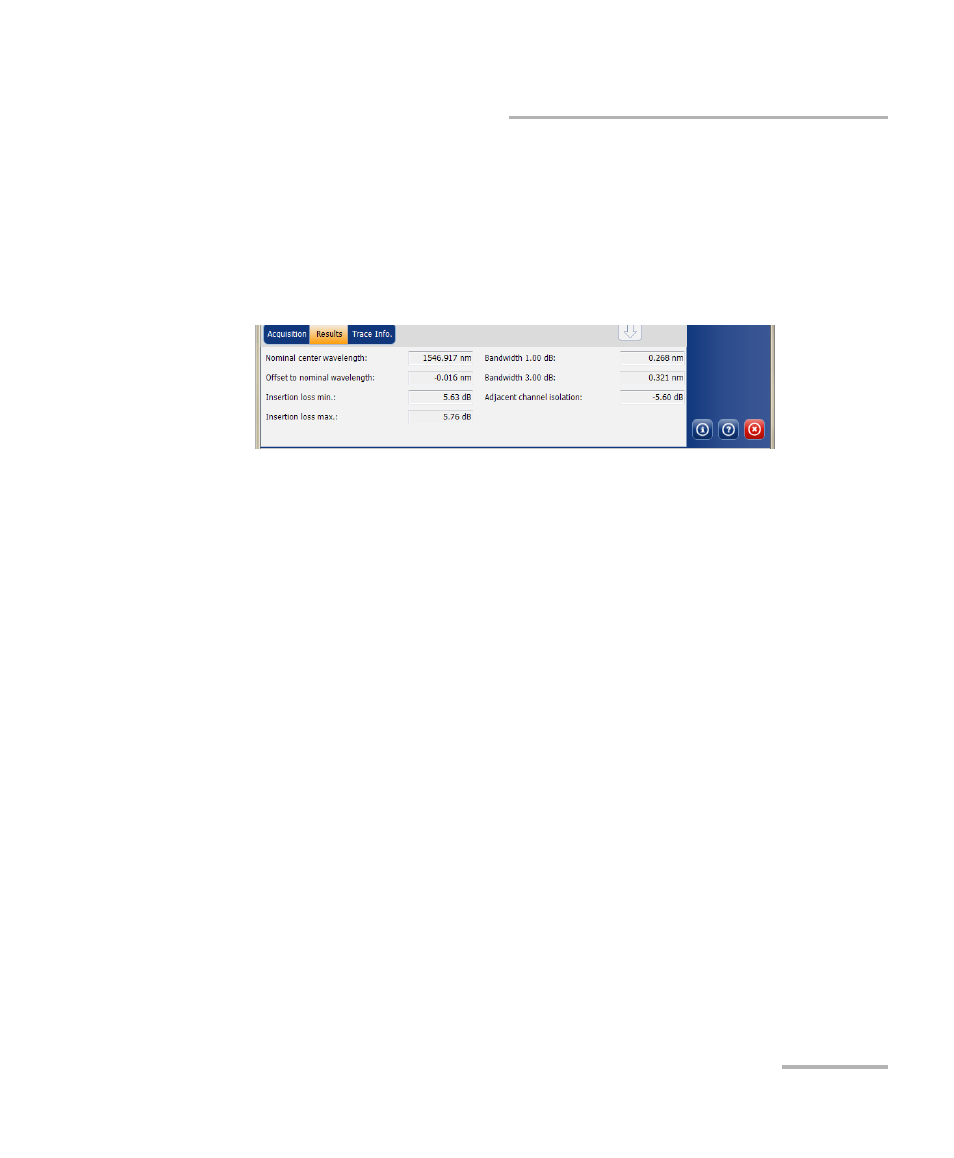
Results Tab
The results table shows the spectral transmittance results for the active
trace. Results for only the channels within the scan range will be displayed.
To view results:
From the main window, select the Results tab.
The following results related to the channels are displayed:
Nominal center wavelength or frequency: single value
representing the channels center wavelength (in nm) or frequency
(in THz).
Offset to nominal wavelength or frequency: offset value applied to
the nominal wavelength (nm) or frequency (THz).
Insertion loss min: minimum difference between a reference
power level and the measured power level (in dB).
Insertion loss max: maximum difference between a reference
power level and the measured power level (in dB).
Bandwidth x at (dB): bandwidth measured by taking the width of a
signal at x dB from the peak.
Bandwidth y at (dB): bandwidth measured by taking the width of a
signal at y dB from the peak.
Adjacent channel isolation: isolation (in dB) taken at the channel
distance on the left or right of the nominal wavelength. The worst
value between the left and right isolation is kept.