Histogram, Highlight alert, Sample histogram – Canon EOS 300 D User Manual
Page 89
Attention! The text in this document has been recognized automatically. To view the original document, you can use the "Original mode".
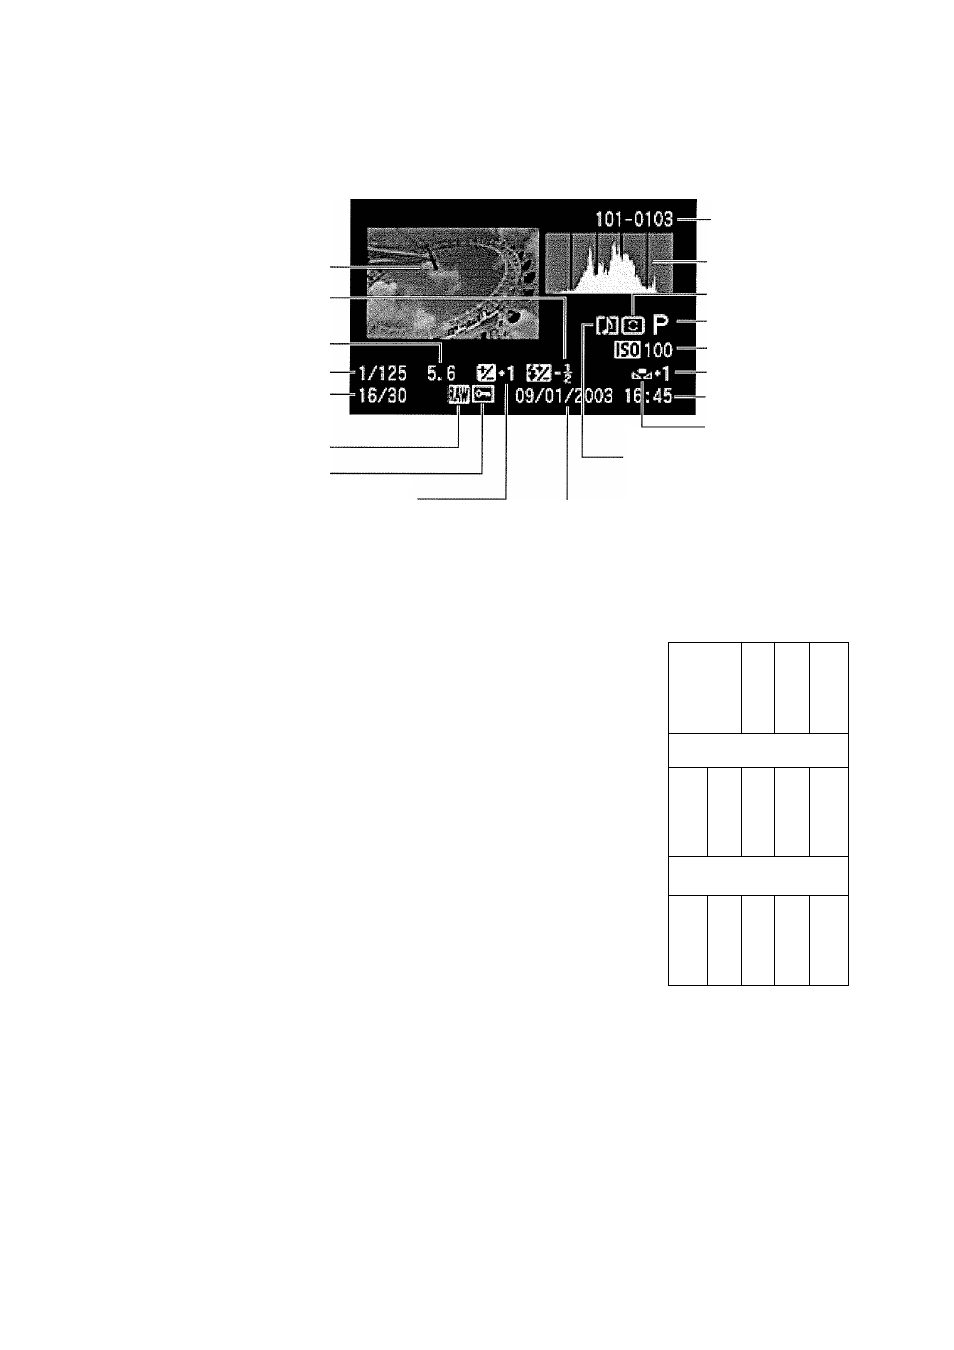
Image Playback
Image Information
Image----------------
Flash exposure
compensation amount
Aperture value
Shutter speed -
Images recorded /■
Total images recorded
Image-recording quality
Image protect
Exposure compensation amount
File No.
Histogram
Metering mode
Shooting mode
ISO speed
WB-BKT
Shooting time
White balance
Audio note
(The camera has no sound
recording feature.)
Shooting date
Histogram
A histogram is a graph indicating the image’s
brightness. The horizontal axis indicates the
brightness level (darker on the left and brighter
on the right), while the vertical axis indicates how
many pixels exist for each brightness level.
The more pixels there are toward the left, the
darker the image. And the more pixels there are
toward the right, the brighter the image.
If there are too many pixels on the left, the
shadow portions will lose detail. And if there are
too many pixels on the right, the highlights will be
washed out. The tones in-between will be
reproduced.
By checking the image and its histogram, you can
see the exposure level pattern and the overall
tone reproduction condition.
Sample Histogram
1-,
Dark image
K
Normal image
^»1
-
—■*'
Bright image
Highlight Alert
When the image information is displayed, any overexposed areas of
the image will blink. To obtain more image detail in the overexposed
areas, set the exposure compensation to a negative amount and shoot
again.
87