Care and use manual – Waters High Performance Carbohydrate Column User Manual
Page 3
[ Care and Use ManUal ]
High Performance Carbohydrate Column
3
Note: Be sure to record results and instrument settings (and configura-
tions) to allow exact reproduction and camparison in the future.
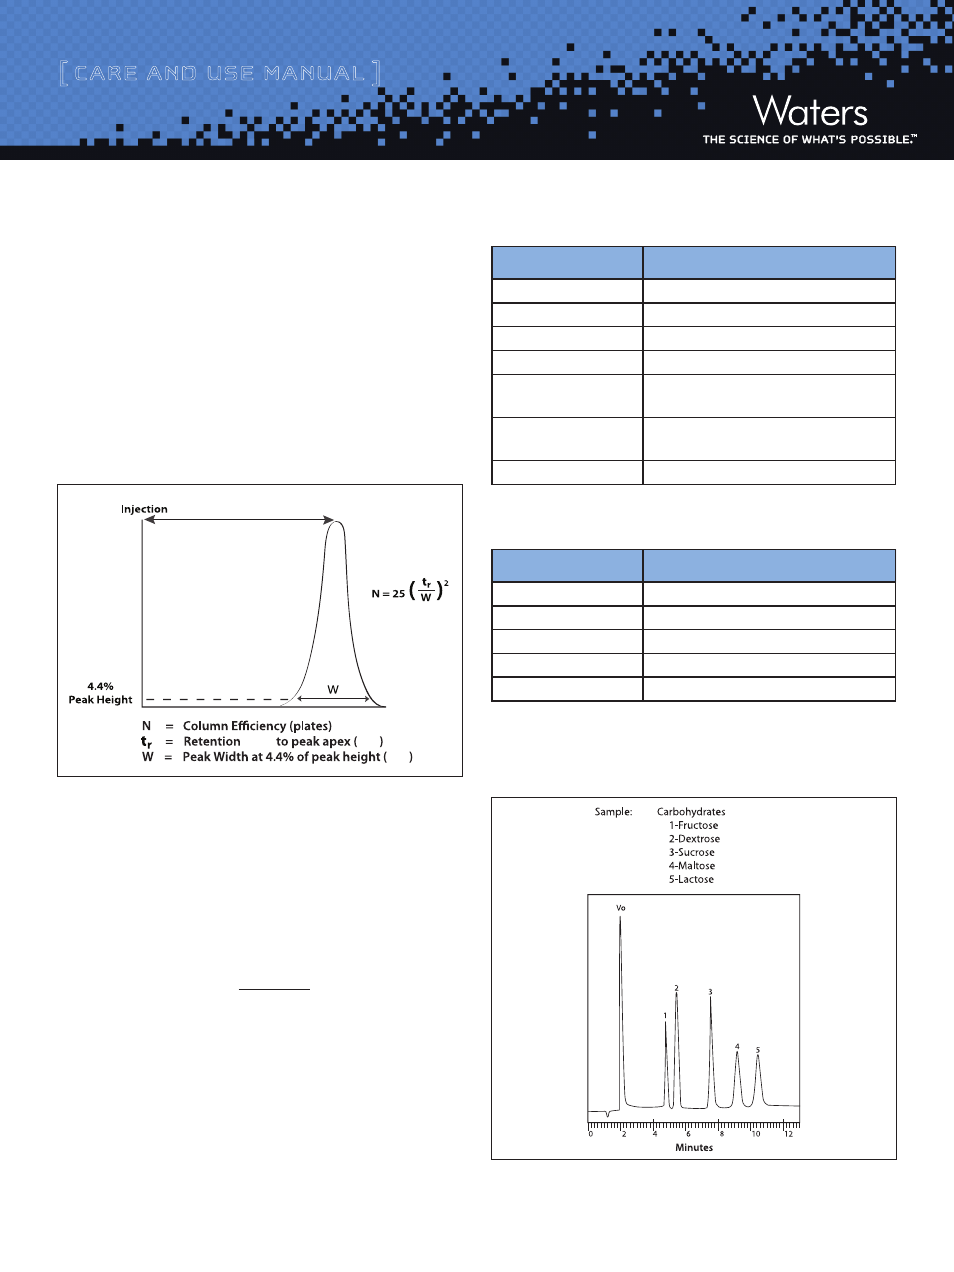
a. Column Efficiency
The sucrose peak in the functional test chromatogram (Figure 4)
can be used to monitor the efficiency of the High Performance
Carbohydrate Column. Typical efficiencies of the sucrose peak can be
measured as outlined in Figure 3. Typical efficiencies of the sucrose
peak on a new column range from 7000 to 9000. The actual value
that you measure will be influenced by the bandspread of your HPLC
system.
Figure 3: 5 Sigma Method for Calculating Column Efficiency
b. Functional Test
A typical chromatogram for the functional test is shown in Figure 4;
the figure shows baseline resolution between fructose and dextrose
and between maltose and lactose.
Rs = 2(RT
2
-RT
1
)
(W
1
+W
2
)
The retention times (RT) and peak widths (W at tangent) are mea-
sured in cm.
A set of standards containing the sugars in your sample in the
desired concentration range should also be analyzed.
Table 1: Functional Test Conditions
Table 2: Functional Test Sample Preparation
The sugars are dissolved in 4 ml water and brought to 10 ml volume
with acetonitrile. Mobile phase should be adjusted to maintain
baseline resolution and run time of approximately 12 minutes.
Figure 4: Functional Chromatography Test
Parameter
Conditions
Sample Sugars (Table 2)
Fructose, Dextrose, Sucrose, Maltose, Lactose
Injection Volume
15 μl (containing a total of 0.72 mg sugar)
Mobile Phase
Acetonitrile/water 75:25 (v/v)
Flow Rate
1.4 ml/min
Detector
Waters Model 410 Refractive
Index Sensitivity of 8
Column
4.6 mm x 250 mm High Performance
Carbohydrate Column
Run Time
12 minutes
Sugars
Amount /10 ml
Fructose
60 mg
Dextrose
120 mg
Sucrose
100 mg
Maltose
100 mg
Lactose
100 mg
t
r
Time
min
min