Sound level meter – NTi Audio XL2 Sound Level Meter User Manual
Page 49
49
Sound Level Meter
The advantage of wav-file recordings is to identify and docu-
ment sound sources after the measurement. For example, at
a live event an excessive peak level may have been measured
and logged. Actually, this peak level was caused by people
shouting nearby the measurement microphone, and not by the
audio system being monitored. The recorded wav-file assists in
verifying this and the test results can then be post-processed.
Pausing Measurement
If any ongoing measurement is paused
, the
XL2 continues the recording of wav-files during
the paused period. The logged data and audio
data can be synchronized using the stored real-
time information.
Events
The wav-files are stored in a folder, named, for
example,
2011-11-30_SLM_000_AudioEvent_0001-0200.
The actual wav-files are named for example, as
xxxx_FS133.0dB(PK).wav (xxxx = incrementing
number)
Another example is environmental noise monitoring: Listening
to the recorded wav-file after the measurement may help to
determine the predominant sound source. The XL2 Analyzer
preserves the original absolute test signal level in the recorded
wav-file.
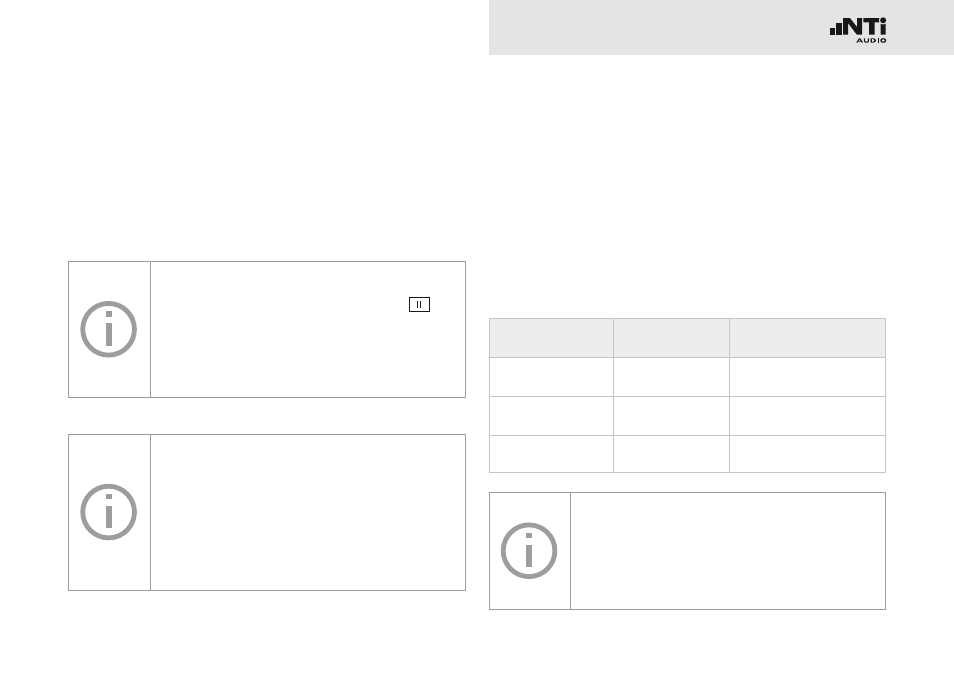
The XL2 Analyzer provides three input ranges to accom-
modate the wide range of input signals. The dynamic range
of the recorded wav-file is set according to the selected in-
put range. For example, at a microphone sensitivity of
S= 20 mV/Pa, the full scale peak level is:
Range Name
Range Level
Full scale peak level
Lower range
10 - 110 dBSPL
117.8 dBSPL
Middle range
30 - 130 dBSPL
135.9 dBSPL
Upper range
50 - 150 dBSPL
159.9 dBSPL
Select the lowest possible input range accord-
ing to the maximum level expected during the
measurement; e.g., If the sound pressure will
always be below 110 dBSPL, select the lowest
input range 10 - 110 dBSPL.