HYDAC HMG 3000 User Manual
Page 52
HMG 3000
Page 52
Edition 11/2007 - V02 R01-S02
Stock no.: 669712
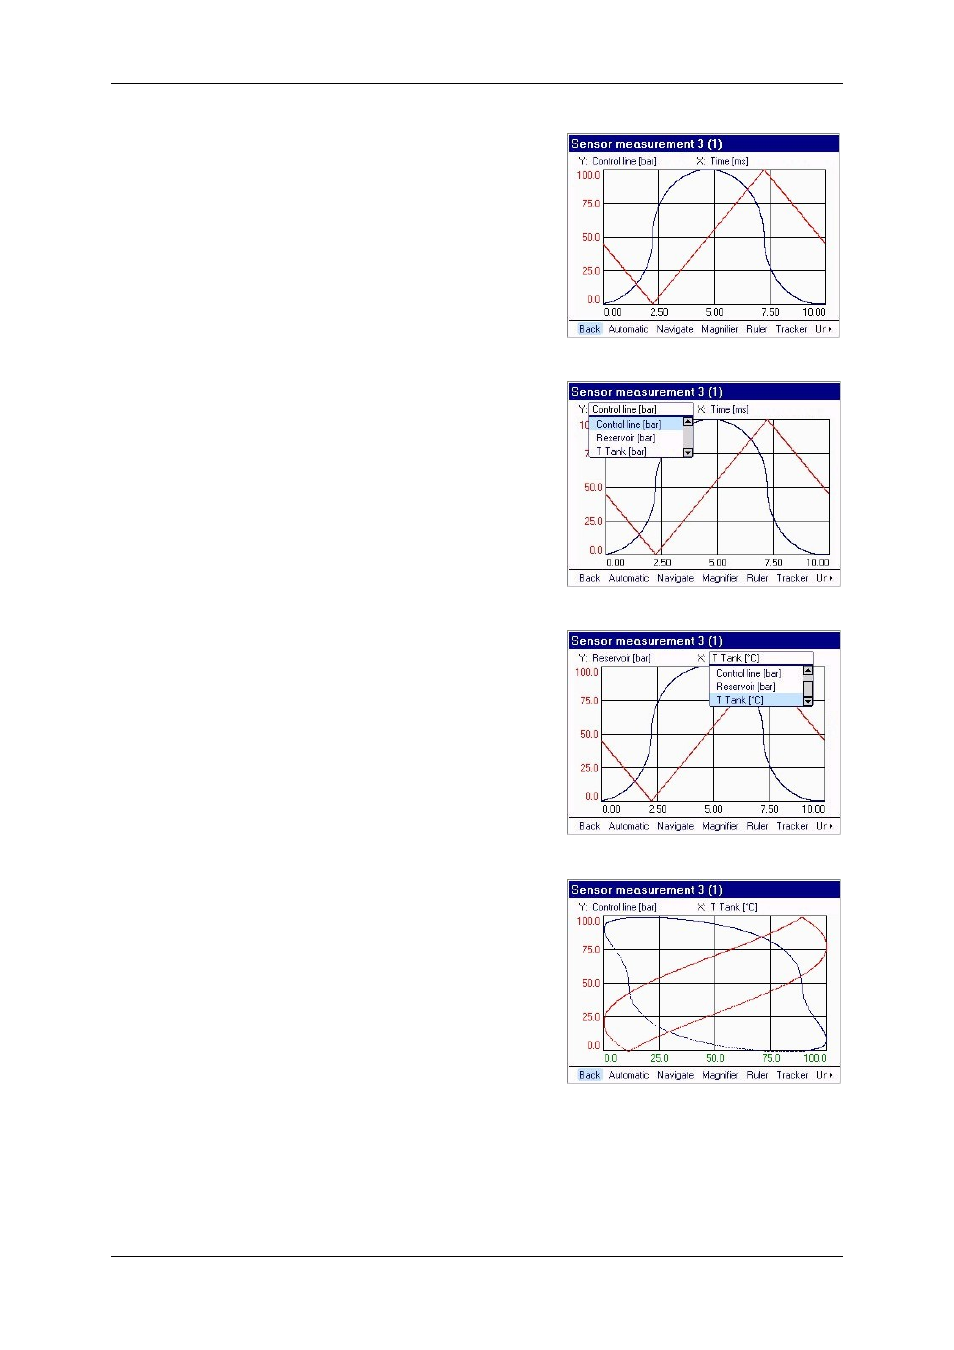
Graph
A measurement can also be rendered as a
measurement curve. To do this, select
Graph
+ OK in the function bar. The
screenshot at the right shows what appears
next in your display. The measurement is
scaled throughout the entire time range
(x-axis) and measurement range (y-axis).
Above the y-axis you can see which channel
is currently scaled along the y-axis.
If you have recorded the measurement using
more than channel, you can select the
channel or sensor to be rendered in the
y-axis. Press Arrow Up (
↑) followed by OK
to change the scaling of the y-axis to
another channel activated for display. This
causes a drop-down box to open, in which all
channels are listed. Select one followed by
OK
to specify y-axis display. (The axis
rendering then also takes on the colour of
the associated measurement curve, cf.
below.) Use Arrow Right (
→) to change the
scaling for the x-axis
.
Generally speaking, the x-axis is the time
axis.
A measurement channel can be
assigned to the x-axis to render the
performance curve of a pump
(P-Q
diagram)
. In the example shown at the right,
rendering as a P-T diagram has been
selected for the control line and reservoir
curves.
The following options are available to you in
the function bar of the Graph menu:
Back, Automatic, Navigate, Magnifier
,
Ruler, Tracker, Undo
, Display all, Settings
and Info.