HYDAC HMG 3000 User Manual
Page 46
HMG 3000
Page 46
Edition 11/2007 - V02 R01-S02
Stock no.: 669712
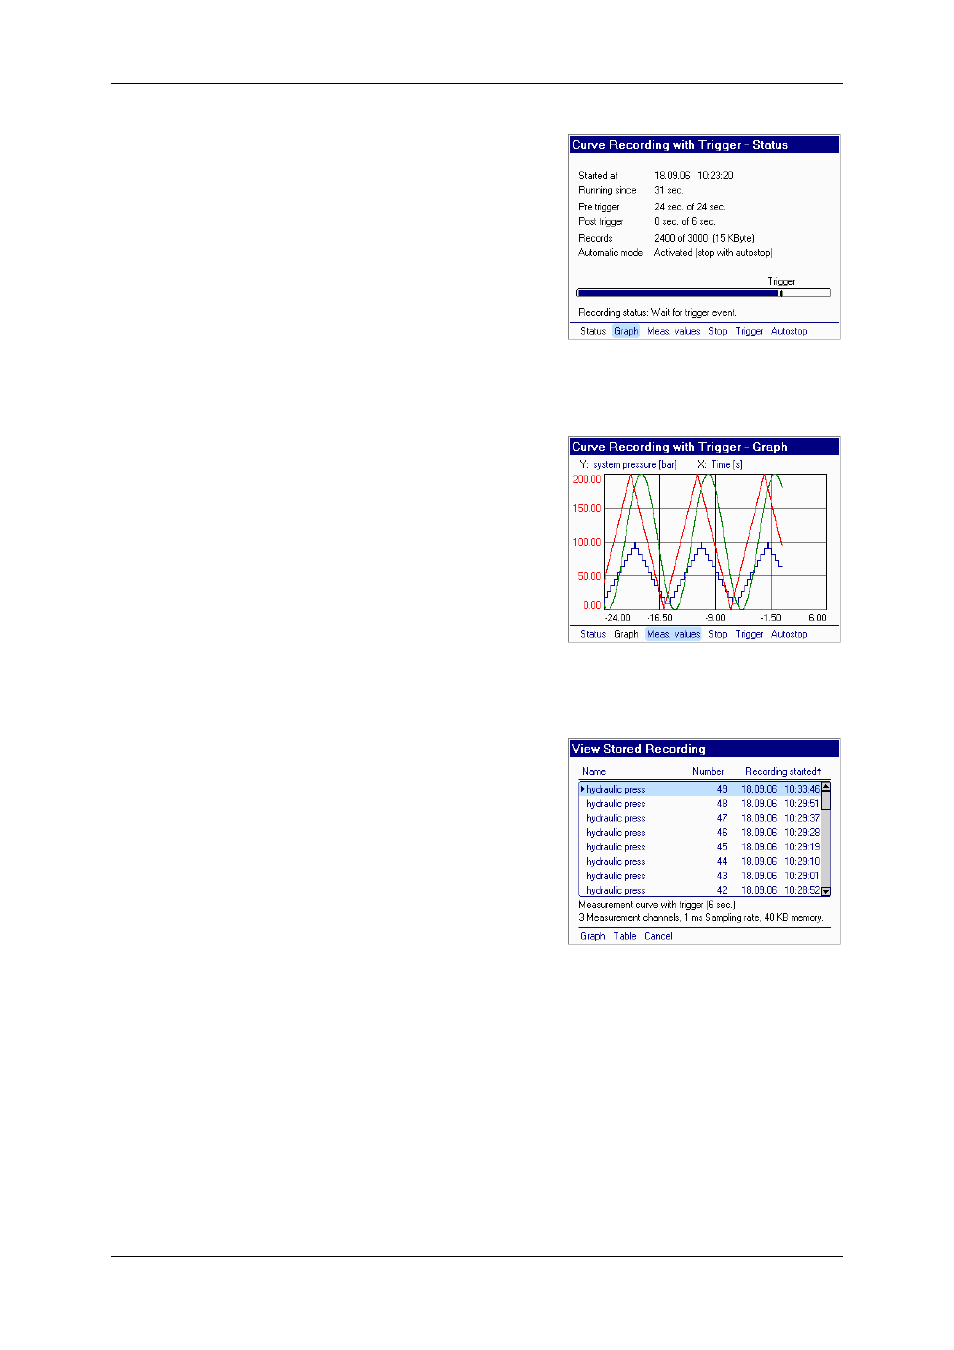
As soon as you confirm saving via OK,
measurement is activated, resulting in the
screen shown at the left. Selecting Graph
causes a measurement curve to be plotted
and displayed (cf. top screenshot), selecting
Measured values
causes you to proceed to
the normal measured values screen (cf.
bottom screenshot). If you like, you can
switch back and forth between the Status,
Graph
and Measured values screens.
You can manually discontinue the recording
currently in progress at any time by selecting
Stop
. This causes the measurement to be
cancelled and a new measurement to be
automatically activated. To discontinue
automatic measurement, select Autostop
followed by OK.
After concluding automatic measurement the
result obtained is a series of measurements,
which can be viewed as a list via View
recording
. To do this, select View
recording
in the Recording menu; you are
now shown all of the measurement curves
just recorded. Select one of the recordings
using the arrow keys. A short overview of the
recorded data appears above the function
bar for the recording selected.
You can have the recording displayed as a
graph or a table via the respective command
options in the function bar. For more details
on this, please refer to Viewing Recordings.