HYDAC HMG 3000 User Manual
Page 15
HMG 3000
Page 15
Edition 11/2007 - V02 R01-S02
Stock no.: 669712
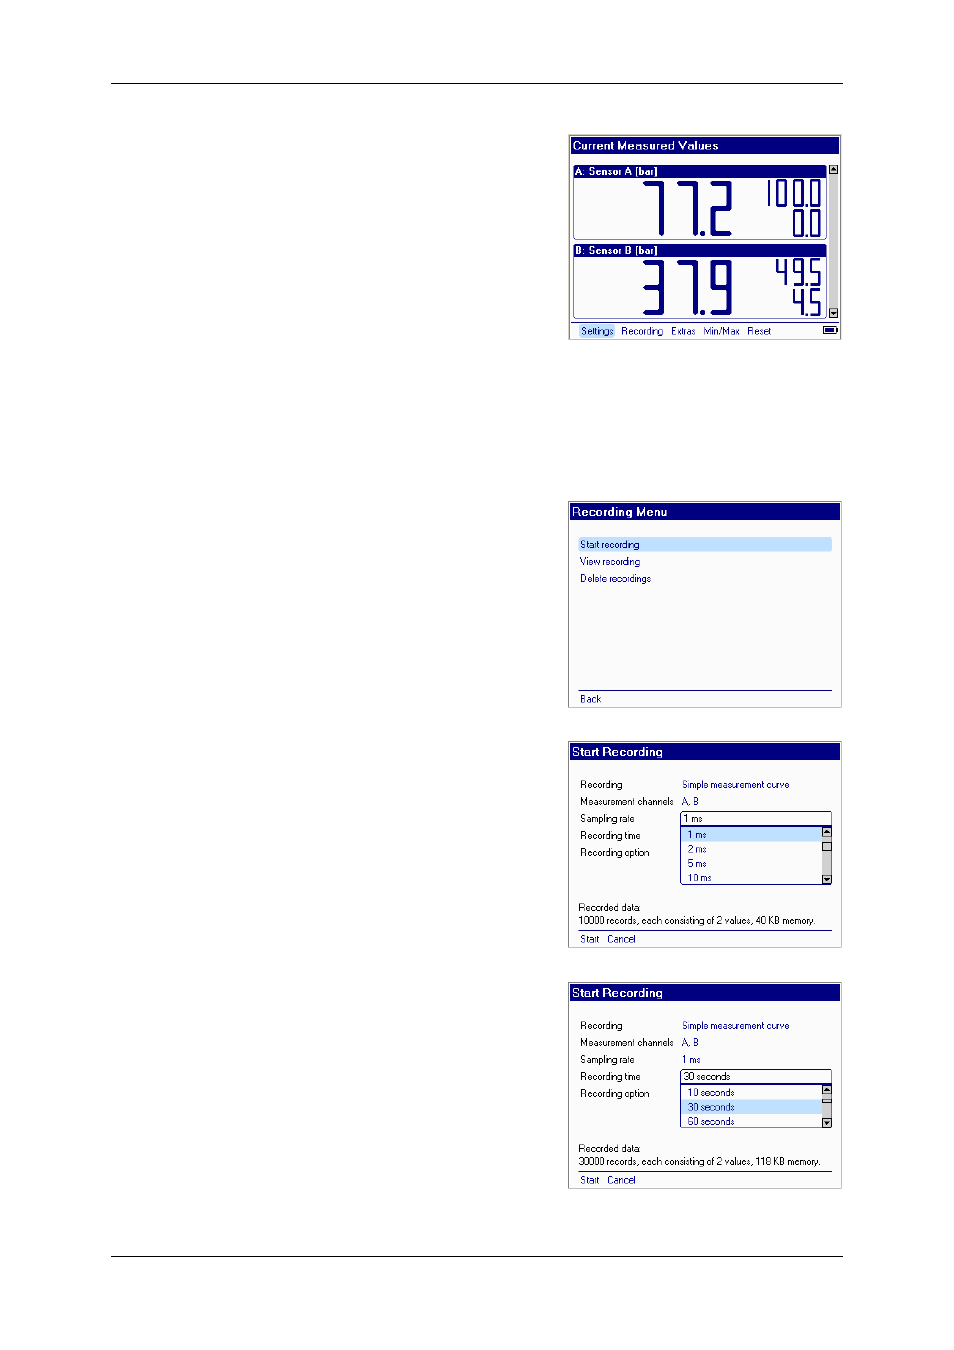
The HMG now shows the measured values
in the 7-segment display panes. Depending
on the setting, the Min/Max values are
shown in addition to the current measured
values.
The Recording menu is used for recording
measurement curves. During recording, the
measured values are recorded for a certain
period of time, stored and then shown as a
graph.
Example of Recording a Measurement
Curve:
The function bar of the Current Measured
Values
menu contains the item Recording.
Select it using the 5-way navigation key,
followed by pressing OK. In the Recording
menu that follows, select Start recording
and confirm via OK.
In the menu that follows, Start Recording,
you are shown the default settings for
recording a measurement curve. In our
example, we want to generate a Simple
measurement curve
with two sensors at
channels A and B with a sampling rate of
1 ms
and a Recording time of 30 s. Then
measurement is to be concluded
.
Simple measurement curve
is already set
in the menu. For the other settings, proceed
as follows:
Using the arrow keys of the 5-way navigation
key, select the third item, Sampling rate. OK
causes a drop-down list to open in which
you select a sampling rate of 1 ms, followed
by confirming via OK. This causes you to
automatically proceed to the Recording
time
line. Press OK. Scroll in the drop-down
list using the arrow keys to 30 seconds,
followed by confirming via OK.