HYDAC HMG 3000 User Manual
Page 38
HMG 3000
Page 38
Edition 11/2007 - V02 R01-S02
Stock no.: 669712
Example of Recording a Simple
Measurement Curve
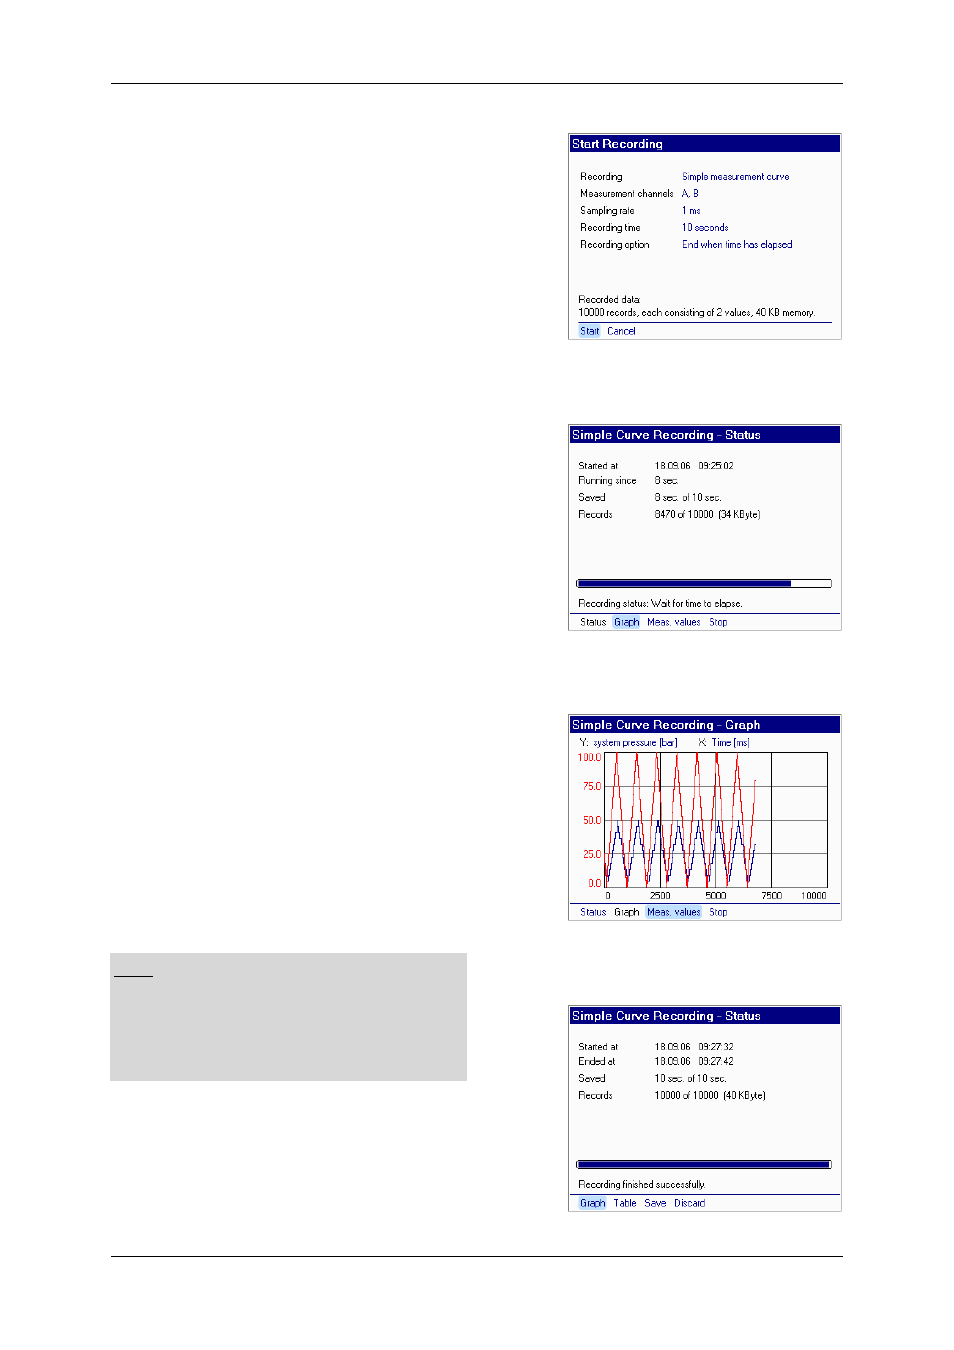
The settings made for the example shown at
the right mean that the measured values of
channels A and B are captured with a
sampling rate of 1 ms (i.e. 1000 measured
values per second, referred to as data
records
(recorded data)), and that recording
is automatically discontinued after
10 seconds. You see the following brief
summary under Recorded data:
10,000 records each consisting of 2 values (1 x
channel A, 1 x channel B), memory usage:
40 kB.
Now you can Start or Cancel (also Esc) the
recording in the function bar. The following
appears in the display (cf. right) after starting
a recording: you see a list showing the start
time, date & time, the time elapsed, and the
number of data records recorded. A
progress bar
shows you the status of your
recording.
The function bar offers you the option of
having the measurement curve plotted
(graph) or the current measured values
displayed. Graphic rendering provides for a
faster visual impression of the changes in
the measured values. To have the
measurement curve plotted while recording,
select Graph + OK. The screenshot at the
right shows you what the plotted
measurement curve might look like.
Note
When plotting a measurement curve,
capturing of the Min/Max values is switched
off as all the measured values are rendered
in the curve during this time.
Recording can be discontinued at any time
by selecting Stop or pressing the Esc key.
When recording is concluded, you have the
option of storing (Save) or discarding
(Discard) the measurement.