Vaisala viewLinc-4.1-M211518 User Manual
Page 83
Chapter 4: Locations
72
©
2012 Vaisala Canada Inc
4
Check and uncheck the ‘Selected’ column in the grid
located in the Locations tab just below the graph. Click
the
live button or click
Options | Refresh
to refresh the
graph and it will graph only the data you have selected
with these checkboxes.
5
Plot threshold lines on a location by checking the
‘Threshold Lines’ column and refreshing again. The
panel displays statistics information for each graph line.
6
Click on the
Group Statistics
tab to see the totals and
max/min ranges for all locations together.
7
Click on the
Scale
tab to adjust the values for the scale of
the graph. The default low/high range is set to auto.
Clicking on this ‘auto’ text enables you to enter new
values for the graph which will be applied when the graph
is refreshed or the
Live
button is selected. There is a
maximum of 16 locations (lines) per trend.
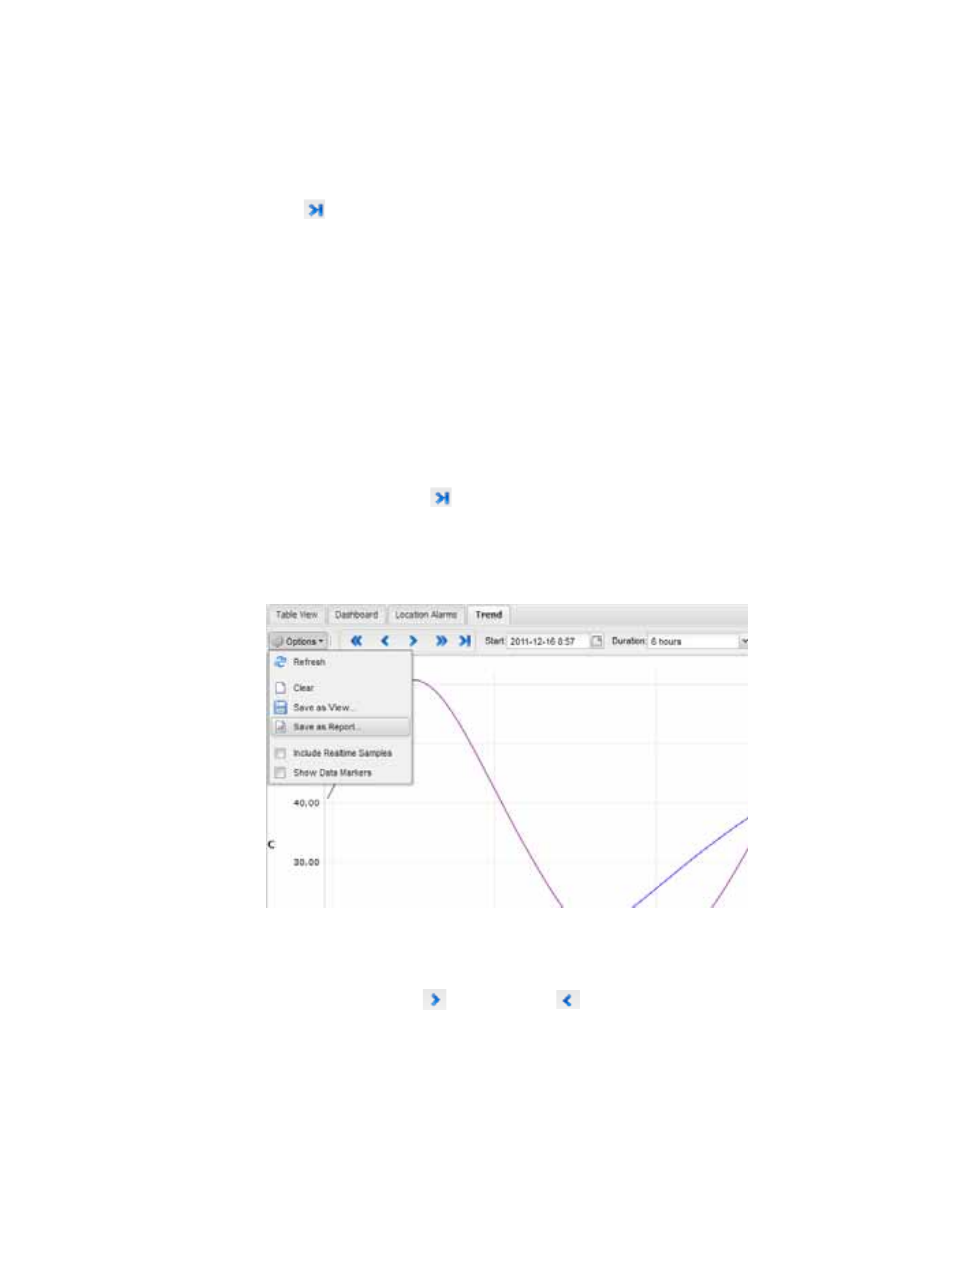
8
Click
Options | Save As Report
and specify a name for
your report. The report will be available with the name
you specified in the Reports section.
9
The trend tab also contains navigation controls which
allow you to navigate historical data trends and refresh
the view as necessary:
• Pressing on the
forward and
back arrows will
adjust the start time accordingly, while pressing on the