Vaisala viewLinc-4.1-M211518 User Manual
Page 133
Generating Historical Data Reports
viewLinc 4.1 Administrator Guide
125
few users are using the system, such as after
business hours.
4
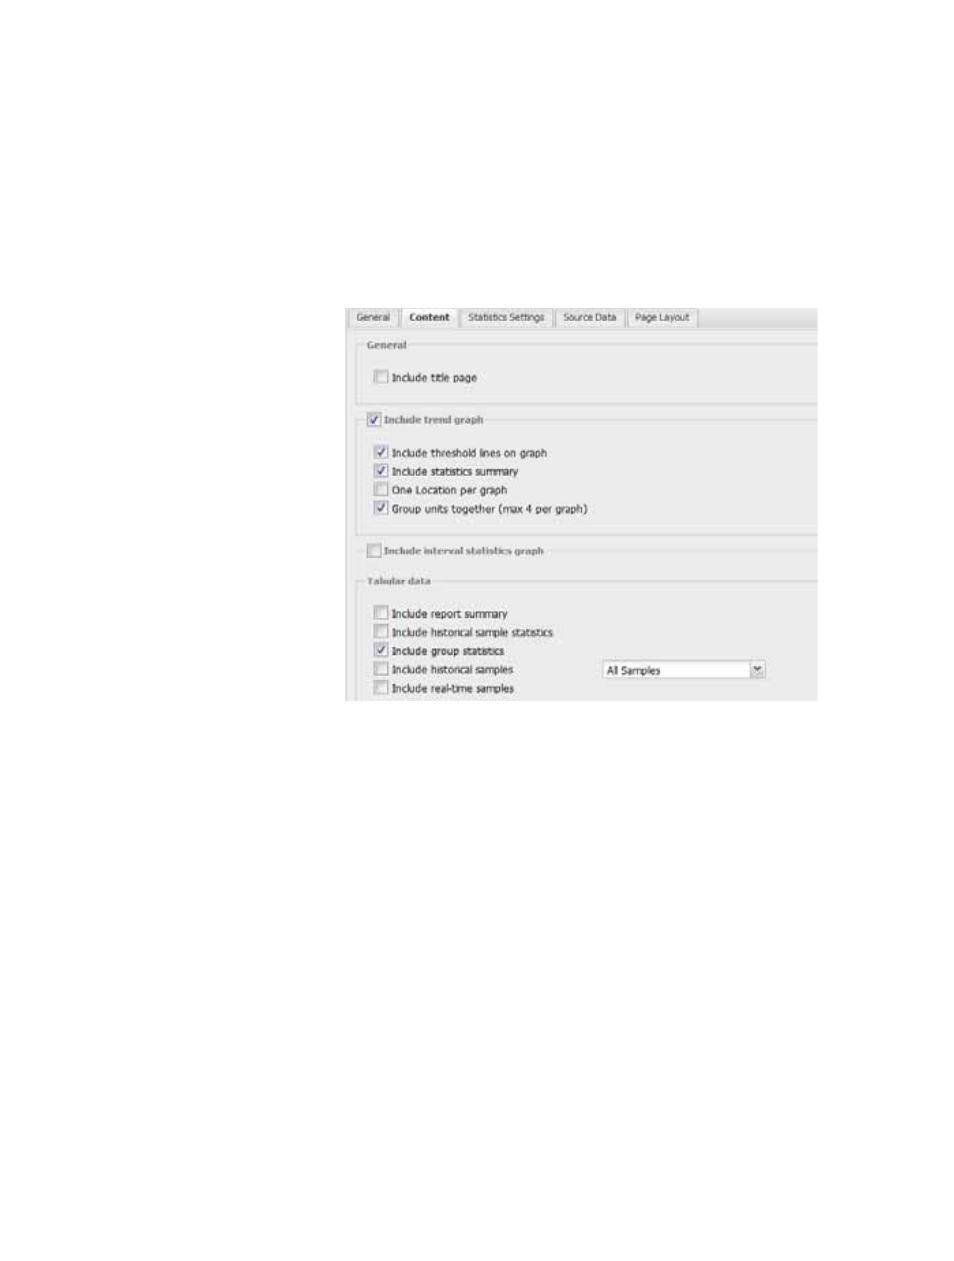
On the Content tab identify the types of data you want
included in the report, including Trend Graph, Title Page,
Interval statistics graph (this allows you to change
Statistic Settings in the Statistic Settings tab), and/or
Tabular Data.
5
If you include the Interval Statistics graph, use the
Statistics Settings tab to define how information will
display on your report, and any statistical information you
want to include:
a
From Statistics Settings, select a statistics interval by
checking the Include statistics at intervals checkbox if
you want to intermittently generate statistics within the
time frame of a report. For example, if your report gen-
erates data based on a seven day (weekly) interval,
you may want to view statistics daily by selecting the
Specify Duration radio box and specifying 1 day, 0
hours.
b
In the Include area, select the types of statistical data
you want to add to the report, including maximum val-
ue, average value, minimum value, standard devia-