Vaisala viewLinc-4.1-M211518 User Manual
Page 134
Chapter 8: Reports
126
©
2012 Vaisala Canada Inc
tion, sample count and mean kinetic temperature
(MKT):
• If you want to specify the activation energy, check
Mean kinetic temperature and specify the
activation energy as KJ/mol.
6
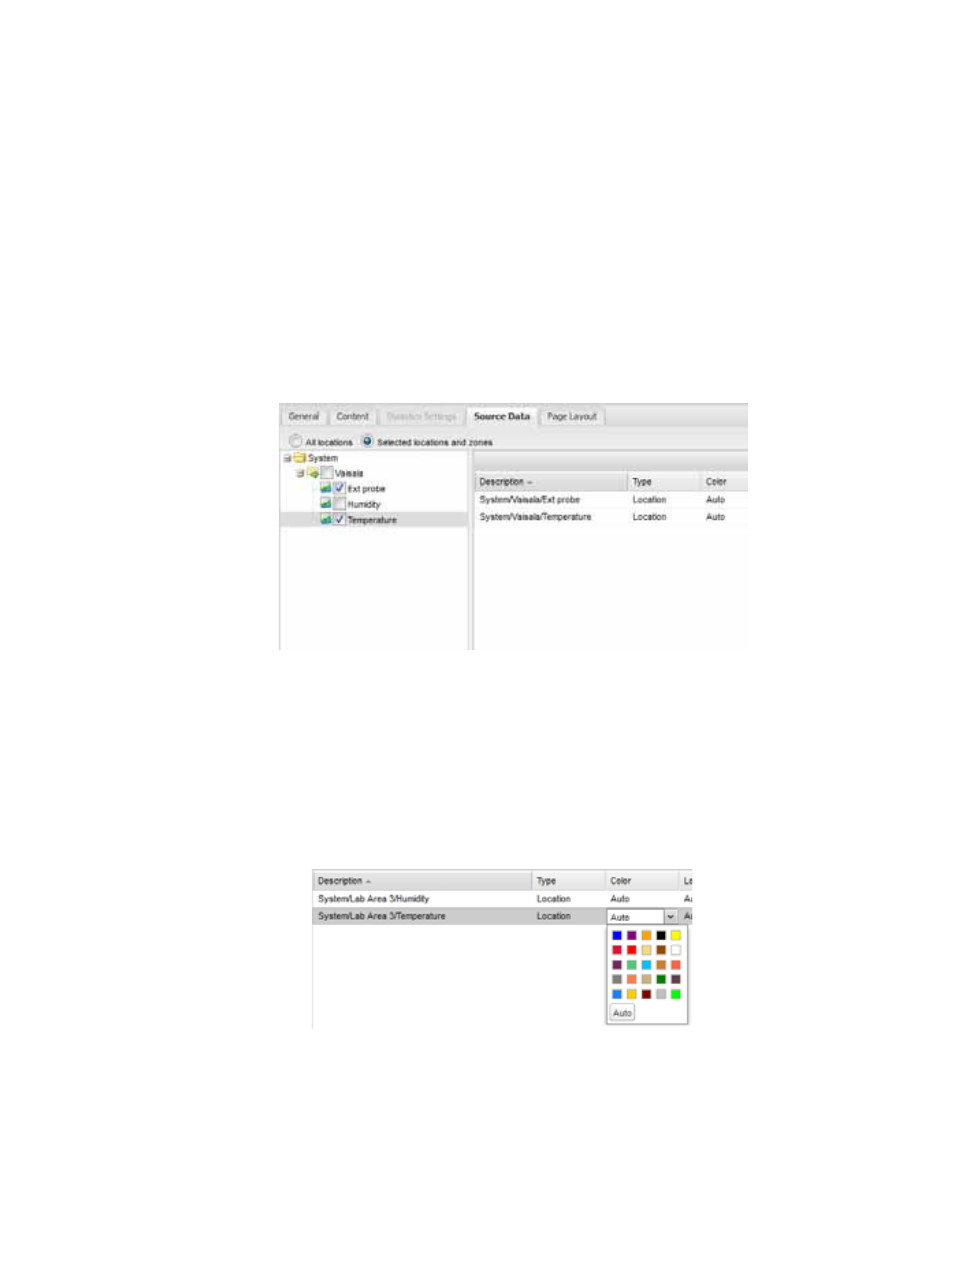
On the Source Data tab, define the report scope and
color spectrum. To report on all locations, select
All
Locations.
The screen will become greyed out to indicate
that all are included. You can also select specific
locations and zones:
a
Select the option
Selected Locations and Zones.
b
To select one or more locations in a zone, check the
checkbox next to the zone or expand the zone and
check the checkbox next to the location name.
c
To add an index to the graph, select
Show Markers
.
d
To specify a color to highlight a specific location’s da-
ta, select the location, then select an option from the
color dropdown. If you select Auto, viewLinc chooses
a color according to the default color spectrum:
e
When the location line colors are set to ‘Auto’ viewLinc
assigns the next free color from a built-in palette of col-
ors (see page 151 for the color spectrum sequence).