Dwyer DLI User Manual
Page 85
85 |
P a g e
Click the
Annotate Data submenu to modify the Annotate Data (see
Annotate Data
).
Click the
Show Summary, Show Composite Graph, Show Graph, and Show Data options to
bring up the Summary, Composite Graph, Graph, and Data tabs, respectively.
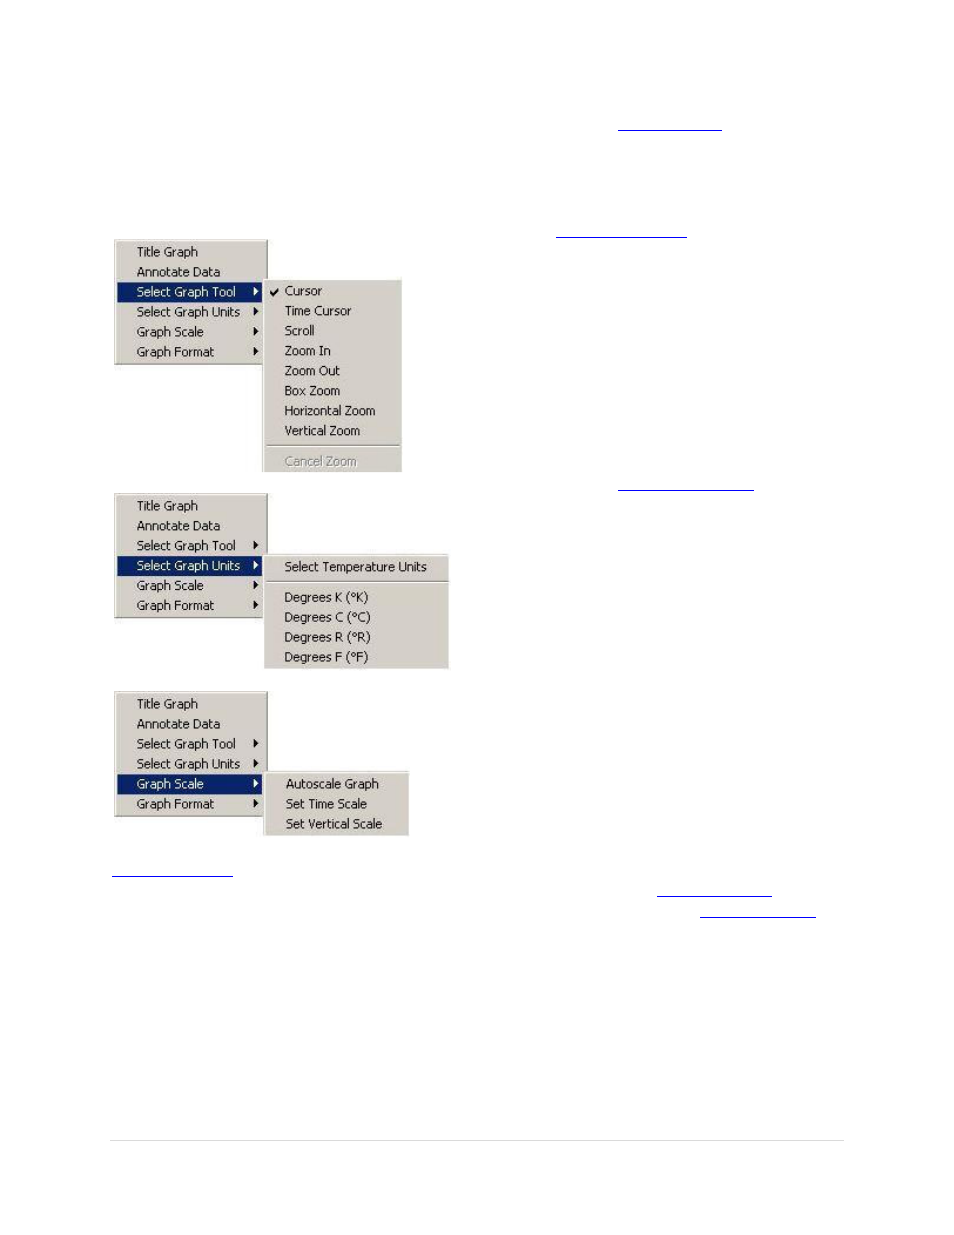
Submenu B
Highlight
Select Graph Tool to change the cursor mode (see
Select Graph Tool
).
Highlight
Select Graph Units to change the type of scaling units (see
Select Graph Units
).
Highlight
Graph Scale to bring up the following box.
Click the
Autoscale Graph option to automatically optimize the vertical scale of the graph (see
Autoscale Graph
).
Click the
Set Time Scale submenu to display a time scale setting form (see
Set Graph Scale
).
Click the
Set Vertical Scale submenu to display a vertical scale setting form (see
Set Graph Scale
).
Highlight
Graph Format to bring up the following box: