Dwyer DLI User Manual
Page 74

74 |
P a g e
Graph Menu: Annotate Data
This feature will be disabled if there is no channel selected. Otherwise, there are two ways to
annotate data.
1. Select the
Annotate Data menu from the
Graph Menu
or the
Right Click Pop-Up Menu
. The
following screen will appear:
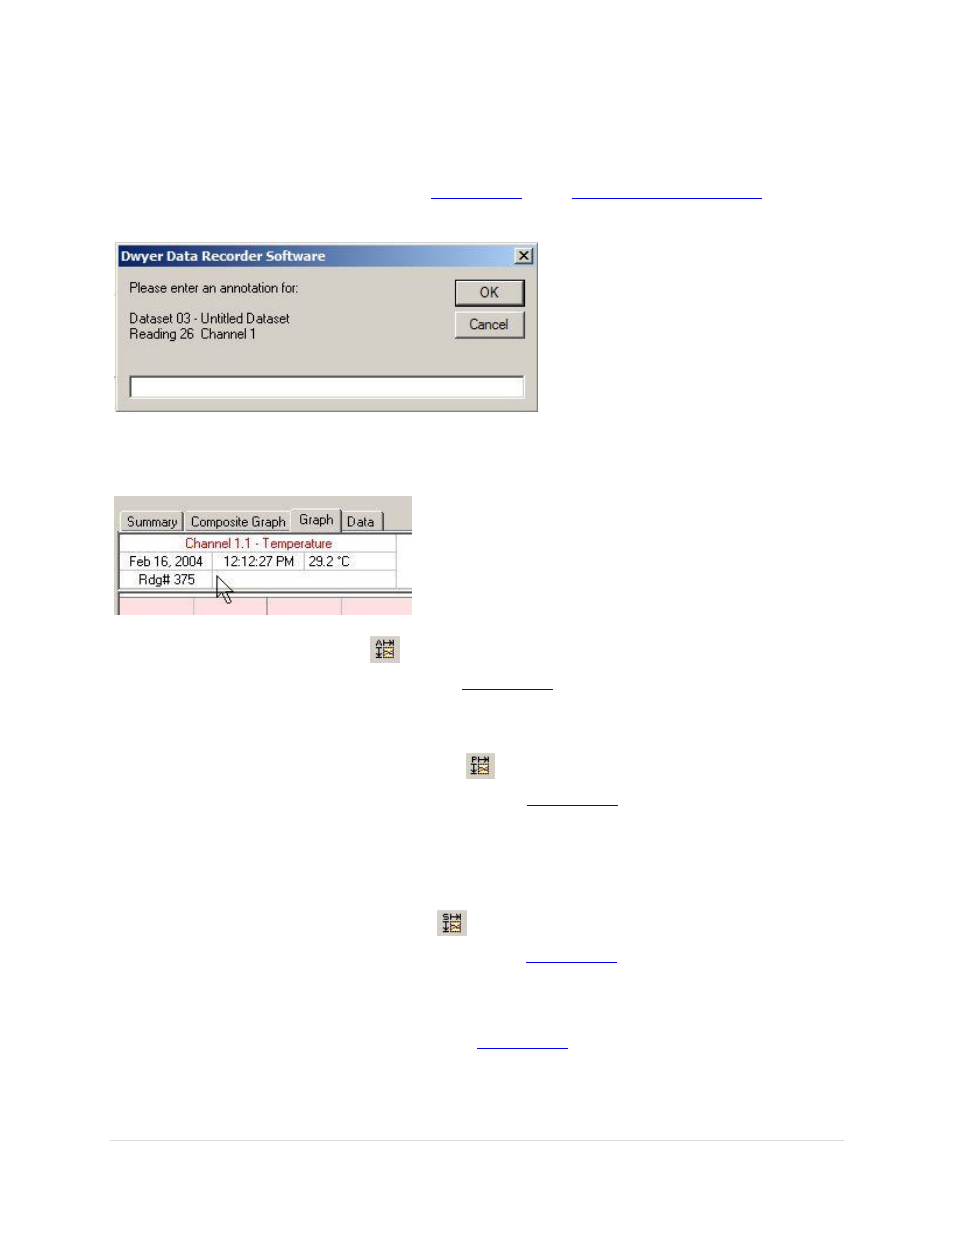
2. Double click the annotate data area on the heading of the graph. Type the annotation in the box as
shown below:
Graph Menu: Autoscale Graph
Select the
Autoscale Graph command from the
Graph Menu
to optimize the vertical scale of the
graph to match the minimum and maximum data points shown on the graph. This provides maximum
resolution for viewing the graph.
Graph Menu: Set Graph to Preferred Scale
Select
Set Graph to Preferred Scale command from the
Graph Menu
to set the graph to the
preferred scale.
If no preferences are set, the graph will show on the vertical scale, the measurement range of the
device (this may differ from the rated operating range shown on the label of the device). The time
scale will begin when the first reading was taken, and end when last reading was taken.
Graph Menu: Synchronize Graph Scale
Select the
Synchronize Graph Scale command from the
Graph Menu
to synchronize the time and
value axes of the graph.
Graph Menu: Select Graph Units
Select the
Select Graph Units command from the
Graph Menu
to select the units to be used when
displaying the graph. The available units will vary depending on the type of data logger used. For
example, the HTDL-10 reads temperature and provides units of degrees Celsius (ºC), Fahrenheit (ºF),
Rankin (ºR) or Kelvin (K). The ISDL-R10 records temperature and humidity and has available 0 ºC,
