Dwyer DLI User Manual
Page 78
78 |
P a g e
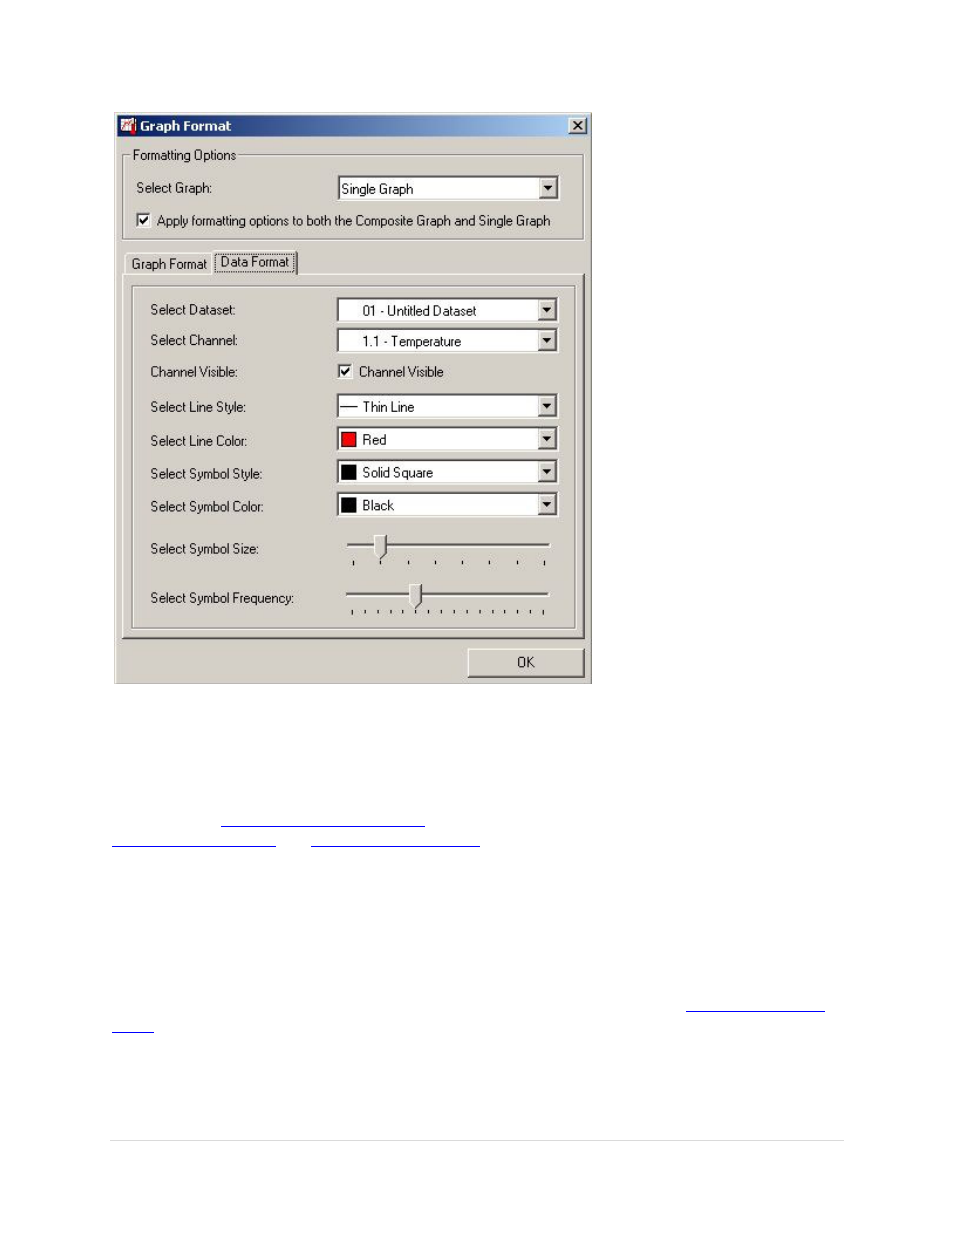
Data Format Tab
This window allows the user to customize the look of the graphical data for each dataset. First, select
the dataset to customize from the dropdown list. Choose the channel from the second dropdown list
(some devices have multiple channels). Then, select the thickness of the line, line color, symbol
style, and symbol color from the remaining dropdown lists. Finally, select the symbol size and
frequency (see
Manipulate Plotting Symbol
) and whether the channel should be visible or not (see
Hide Selected Channel
and
Show Hidden Channels
).
Manipulate Plotting Symbol
The
Select Symbol Size slider and the Select Symbol Frequency slider are used to manipulate the
plotting symbols. The zero setting removes all plotting symbols, and higher settings will
approximately double the number of symbols on the graph as the slider is moved up one notch.
Hide Selected Channel
Uncheck the
Channel Visible option to hide the selected channel or choose the
Right Click Pop-up
Menu
to hide the selected channel.