Navigating through time – Nexo NEMO User Manual
Page 40
NEXO
NeMo User Guide v1.3
Page 40 of 50
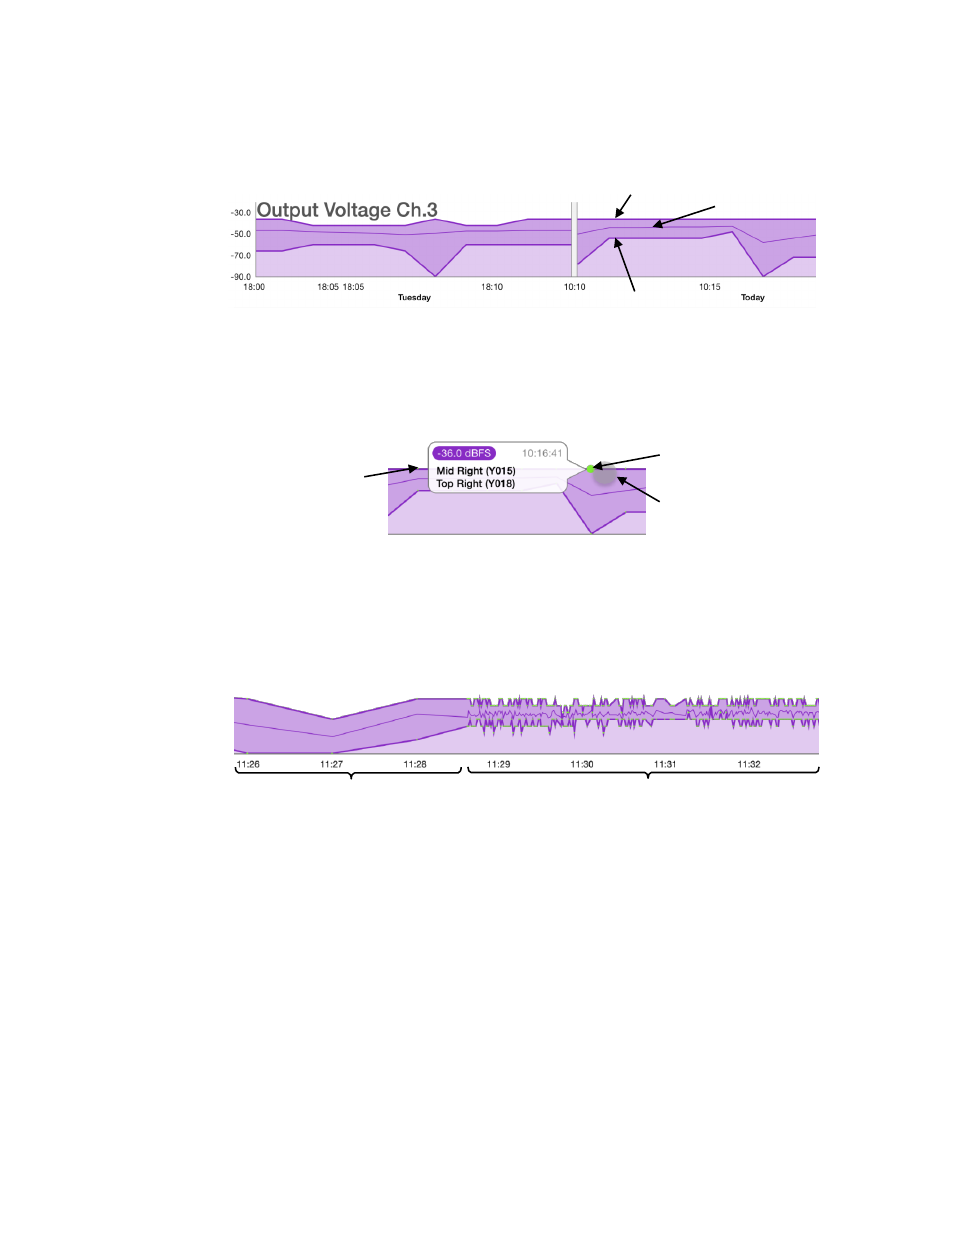
The horizontal axis is the time, and the vertical axis the value of the
parameter. NeMo adapts the scale of the latter depending on the actual
values in the interval of time that is represented.
Each graph contains three curves, one for the maxima, one for the
minima, and one –thinner- for the average. The small gray spaces
between curves are for the moments where the log was not being
recorded (on the picture above, for instance, log was not recorded
between Tuesday at 18:15 to Today at 10:10).
Put your finger near a curve. The recorded points are displayed in another
color, and a bubble appears to give detail about the closest point to which
your finger is. It contains the value, the date, and the NXAMPs realizing
this value at that date. Slide your finger to see the details about other
points.
The resolution of recording is:
Navigating through time
To zoom in and out, put two fingers on the screen and move them closer to or
away from each other. You can visualize from a few minutes to several days.
To scroll through all the recorded points, put your finger on the blue area of
the time slider, located in the header of the Log Graphs section, and drag it to
the left (older) or to the right (more recent). Indicative dates are displayed in
the time slider.
Maximum
Average
Minimum
Finger
Recorded
point
Closest recorded
point
Five latest minutes: NeMo records the
maximum, minimum and average over
one second.
Before the five latest
minutes: NeMo saves the
maximum, minimum and
average over one minute
into the Log Record.