Measurement gating, Using statistics and graphing, Operator's manual – Teledyne LeCroy CANbus TD and CANbus TDM - Operators Manual User Manual
Page 35
Operator's Manual
CANbus-TD-TDM-OM-E RevB
35
Peak to Peak - Difference between the Maximum and Minimum data values.
Rise (10-90), Rise (20-80), Rise@Level - Transition time on the rising edge. Three
selections are available for the user to determine at which vertical level the
measurement is made.
Top - Value of the uppermost state in a bimodal waveform, such as a CAN Message.
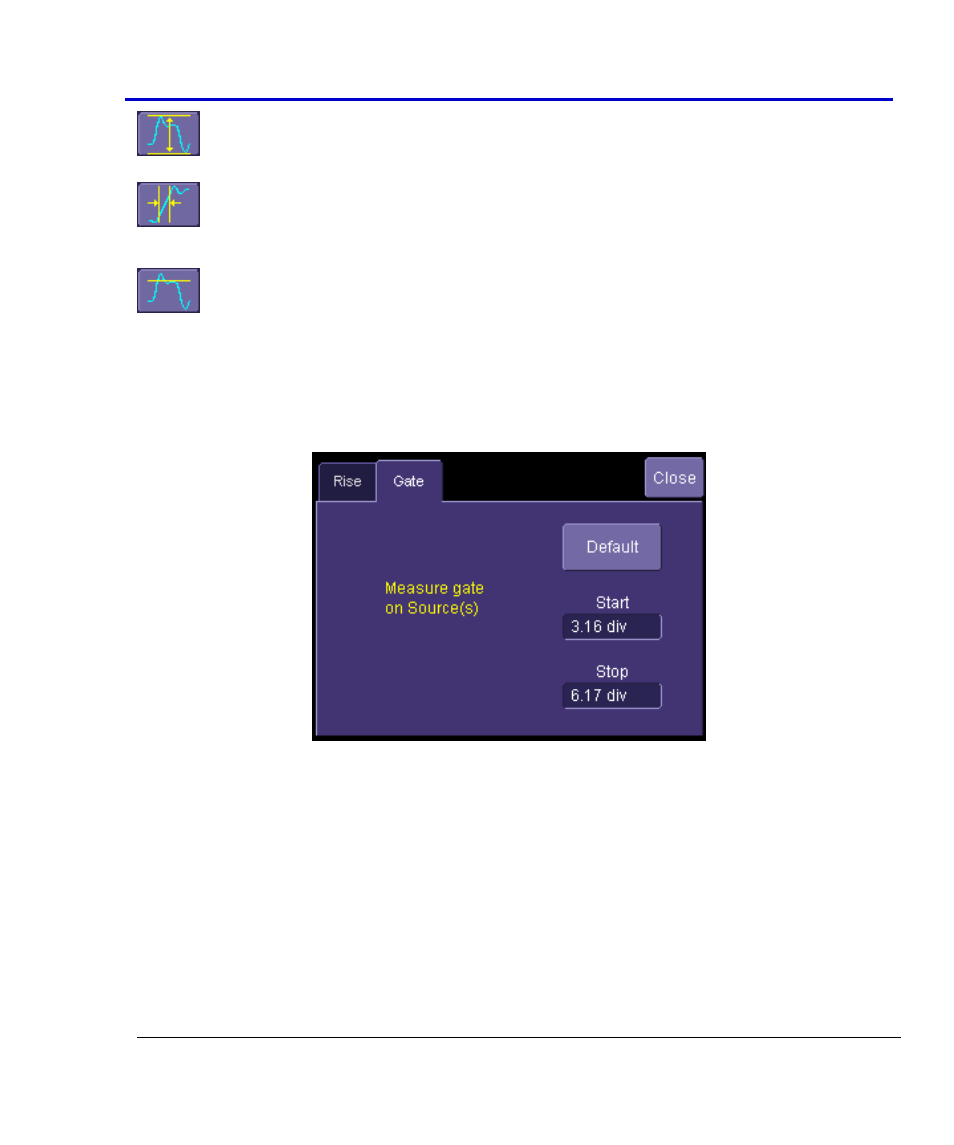
Measurement Gating
Gating is available on each parameter to allow you to set a measurement window that the
parameter should be active in. This allows you to eliminate unwanted portions of the
acquisition from your measurement.
1. Touch the the appropriate measurement (P1, P2, etc.) or choose Measure→Measure
Setup and then touch the appropriate measurement tab (P1, P2, etc.).
2. Touch the Gate tab and enter the start and stop for the gate.
Using Statistics and Graphing
Statistics and Histicons are included with every LeCroy oscilloscope. They allow you to gather
numerical and visual information on the distribution of your various measurements.
You can turn on Statistics and Histicons separately in the Measure dialog. Touch the
appropriate box to place a checkmark and turn it ON, or touch it again to turn it OFF.