Canbus tdm graphing and statistical analysis, Operator's manual – Teledyne LeCroy CANbus TD and CANbus TDM - Operators Manual User Manual
Page 17
Operator's Manual
CANbus-TD-TDM-OM-E RevB
17
CANbus TDM Graphing and Statistical Analysis
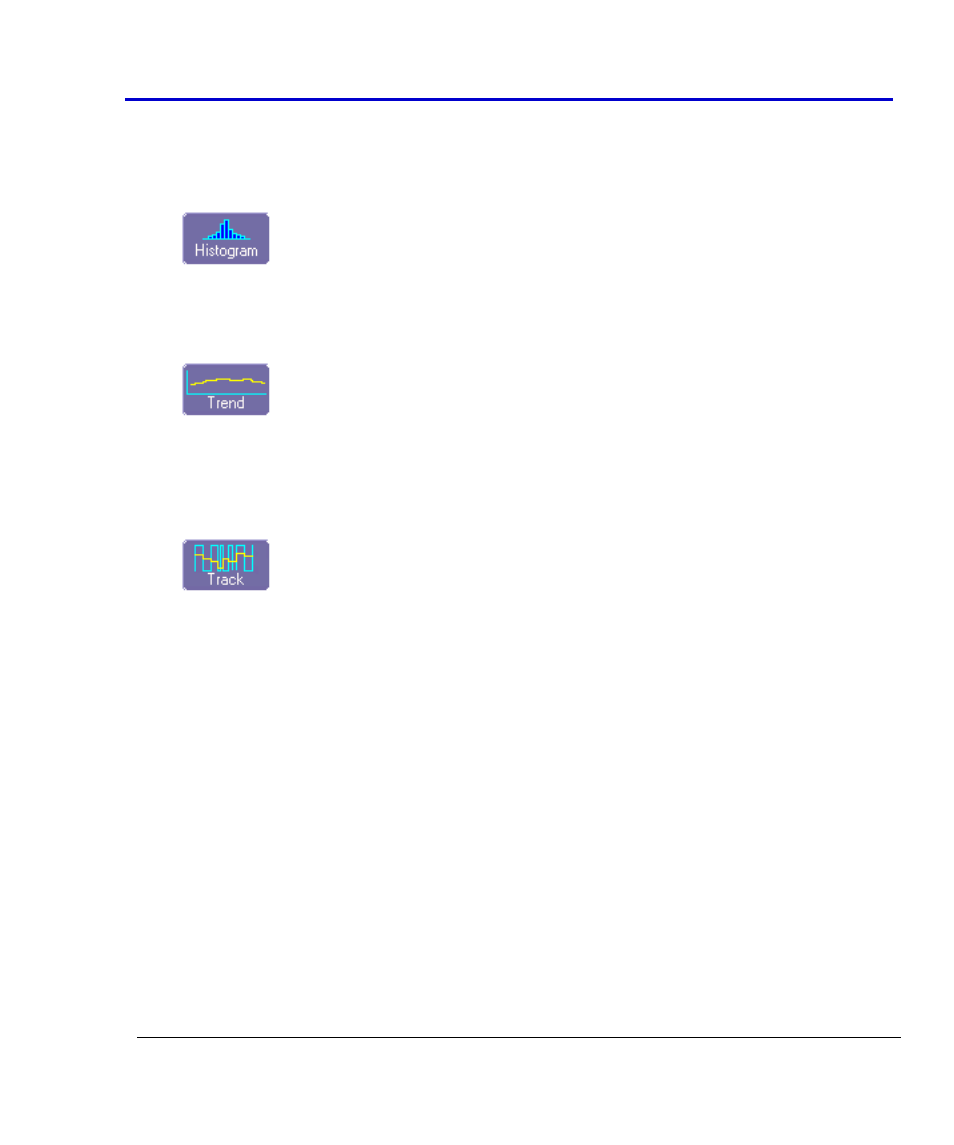
Histogram - The Histogram displays a statistical distribution of a measurement
parameter. Histogram is helpful to understand the modality of a measurement
parameter, and to debug the root cause of excessive variation.
Trend - The Trend statistical tool visualizes the evolution of a timing parameter over time
in the form of a line graph. The graph’s vertical axis is the value of the parameter; its
horizontal axis is the order in which values were acquired. Trend is typically used for a
multi-shot acquisition. Trend is analogous to a chart recorder.
Track - The Track displays a time-correlated accumulation of values for a single
acquisition. Track can be used to plot the values of CAN data and compare them to a
corresponding analog signal, or observe changes in timing. Track is typically used for a
single-shot acquisition. A long acquisition with many parameter measurements analyzed
with Track could provide information about the modulation of the parameter.