Measuring canbus performance using canbus tdm, Operator's manual – Teledyne LeCroy CANbus TD and CANbus TDM - Operators Manual User Manual
Page 15
Operator's Manual
CANbus-TD-TDM-OM-E RevB
15
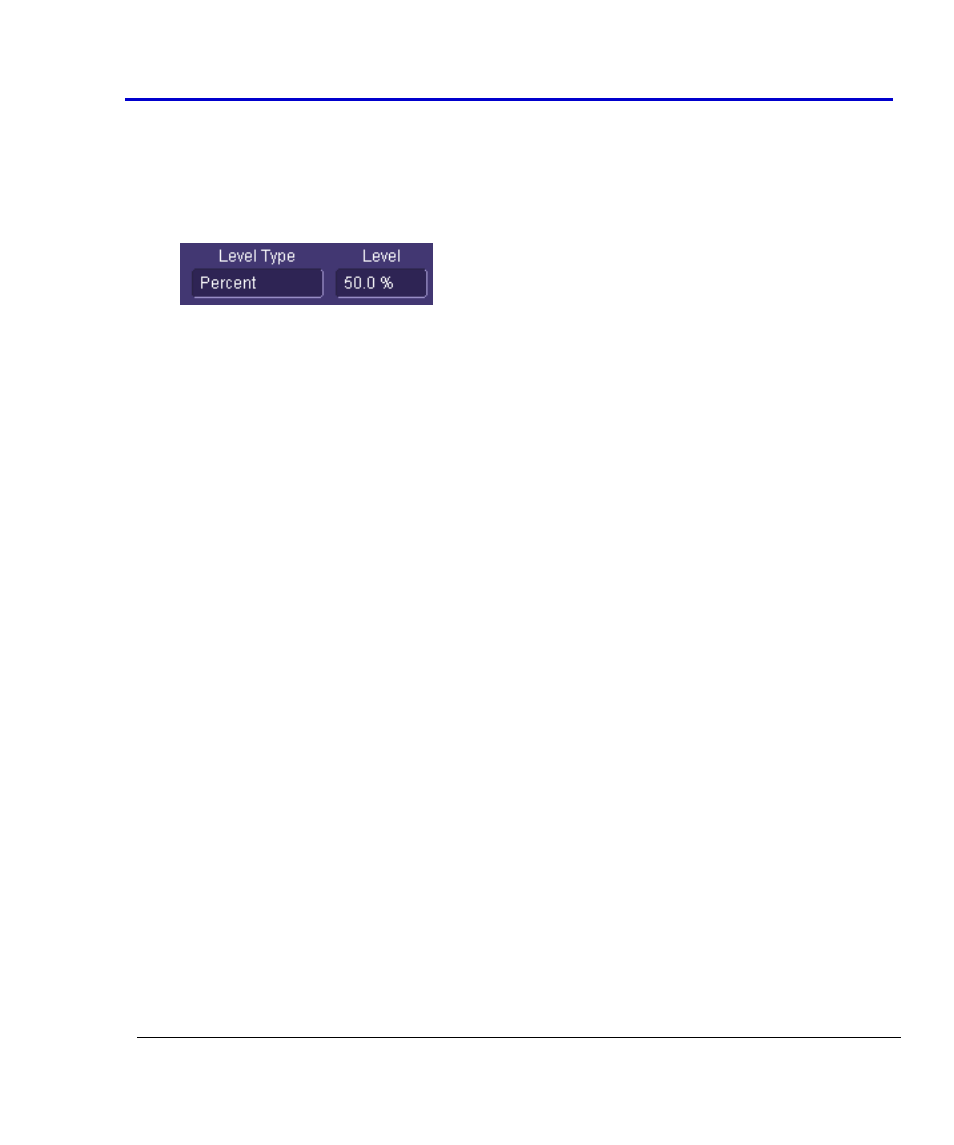
Adjust knob to adjust. Or touch inside the number area twice and select a value using the
pop-up numeric keypad.
The set Level appears as a dotted horizontal line across the oscilloscope grid.
If your initial decoding indicates that there are a number of error frames, make sure that
the level is set to a reasonable value.
Measuring CANbus Performance Using CANBUS
TDM
Overview of CANbus TDM (Trigger, Decode, Measure/Graph)
Basic oscilloscope tools can be extremely helpful to understand single-shot events. However,
their utility in measuring performance of a CAN Bus system can be very limited. It is usually
necessary to obtain large quantities of data before you can be sure that system performance is
within specified limits. The following are typical examples of actions to assess CAN Bus system
performance:
Measure Timing Δ Between CAN and Analog Signals & Accumulate Statistics - Measure
the time difference between an analog signal and CAN signal generated in response to it
(or vice-a-versa). View the mean, minimum, and maximum timing values, the number of
samples, and the standard deviation of the measurements.
Measure Timing Δ Between Two CAN Messages & Accumulate Statistics - Same as
previous, but with two CAN signals.
Measure Timing Δ From the Trigger Point to a CAN Message - Same as previous, but the
trigger point can be anything - a CAN message, an Analog signal, a Pattern of signals, a
Dropout condition, etc.
Measure Timing, Accumulate Statistics, View Distribution - Instead of just looking at
numerical values, graph/plot the distribution as a histogram to better understand the
shape of the distribution, the quantity of extreme events, and determine underlying
cause.
Graph/Plot CAN Data Values from a Single Acquisition - Extract CAN Data values in
decimal format and compare them to an analog signal in a time-correlated fashion.
Graph/Plot CAN Data Values Over Multiple Acquisitions - Extract CAN Data values in
decimal format and graph/plot them over multiple acquisitions.
Measure CAN Bus Load, Graph/Plot - Understand how bus loading relates to other CAN
and Analog signal events.